Who’s losing income during the pandemic?
Men working in finance and insurance are the only group who haven’t seen their wages go down.
14 June 2020


Millions of workers across all sectors of the economy are currently on furlough. Millions more have had their hours cut or lost their jobs. But our new analysis has revealed an important story hidden behind the numbers: how the intersection of gender and class affects how likely you are to have lost work and income during the pandemic, with men in white-collar jobs the least impacted. Notably, men in the finance sector have experienced no loss of earnings on average, whilst women across all sectors and all other men have experienced a loss of earnings on average.
It is not surprising that the people most likely to have been furloughed, lost work, or had their hours cut, work in the accommodation and food services sector, where 85% of workers have been affected. The sector has been almost entirely shut down by the government’s lockdown measures. One in four workers in this sector have lost hours, one in ten have lost their job altogether, and half are furloughed. Other highly affected sectors are: education, with 60% of employees affected and nearly half having lost hours; manufacturing and construction (55% affected); and wholesale, retail and motor trades (54% affected).
Figure 1: Workers in public administration and defense, and financial and insurance services are amongst the workers least affected financially by the crisis
Proportion of employees employed in February 2020 reporting losing hours, losing their job, or being put on furlough in April 2020, by sector
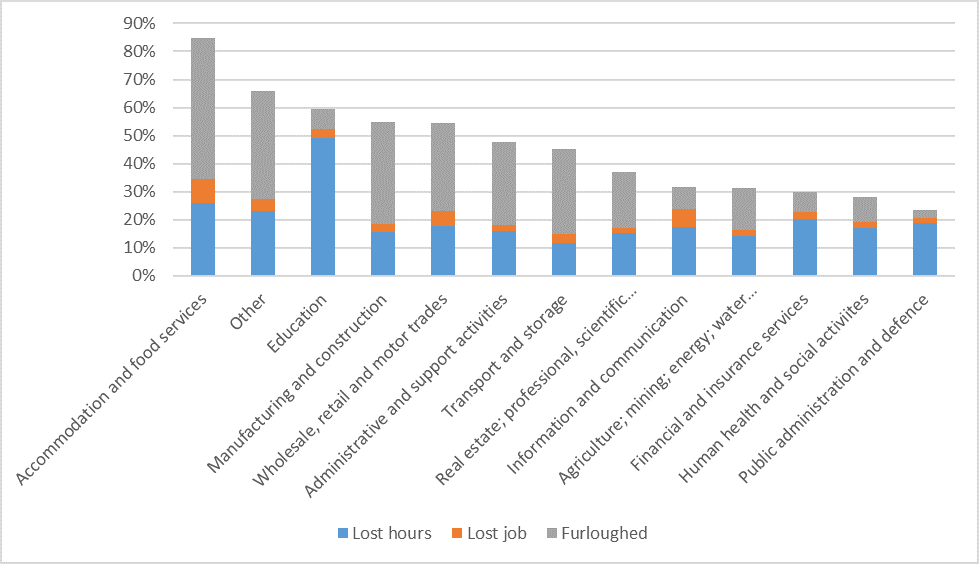
Source: NEF analysis using Understanding Society COVID-19 wave 1; linking to Understanding Society Wave 9 for sector
In contrast, other sectors are relatively better protected. Given the demand for health and care services, it’s unsurprising that roles in human health, social activities and public administration have faced the lowest number of job cuts. Still, it’s interesting to note that even in these key sectors, around one in five employees have been affected. Other sectors, such as financial and insurance services, have also experienced less disruption, with one in three (30%) workers affected in some way.
Millions of people losing hours and being furloughed show the level of disruption caused by the crisis, and the potential for future job losses as the furlough scheme is unwound, especially without other forms of active government intervention.
And the data confirms that men and women are impacted differently economically. Men and women are equally likely to have lost their jobs, with 4% of those employed in February reporting they had lost their jobs by April. But men are more likely to have been furloughed (23% of men have been furloughed compared to 19% of women overall), whilst women are more likely to have had their hours cut without being furloughed (18% of men report lost hours compared to 24% of women).
But these figures are not necessarily indicative of the impact that the crisis is currently having on peoples’ material wellbeing. To get a more accurate estimate of this, we analysed data on self-reported earnings in February, compared to April. This reveals striking differences in the impact on earnings for men and women across different sectors.
On average, both men and women employed in February have lost approximately 10% of earnings. But notably, on average, men working in the financial and insurance services sector have experienced no loss of income. This is not true across any other sector, making men working in finance and insurance services the only group not to have lost income on average. By contrast, men in all other sectors and all women have lost income on average. Average earnings have fallen the furthest in traditional blue-collar sectors such as manufacturing and construction, and transport and storage, as well as those sectors directly affected by lockdown arrangements, such as accommodation and food services.
Figure 2: Men in financial and insurance services have experienced no loss of earnings
Proportion of employees employed in February 2020 reporting losing hours, losing their job, or being put on furlough in April 2020, and change in weekly net income, by sector and gender
Sector | Average change in net weekly earnings, Feb 2020 — April 2020 (all) | Average change in net weekly earnings, Feb 2020 — Apr 2020 (male) | Average change in net weekly earnings, Feb 2020 — Apr 2020 (female) |
Agriculture; mining; energy; water supply | -4% | -4% | -4% |
Manufacturing and construction | -10% | -11% | -6% |
Wholesale, retail and motor trades | -6% | -7% | -4% |
Transport and storage | -11% | -11% | -20% |
Accommodation and food services | -21% | -24% | -7% |
Information and communication | -7% | -7% | -3% |
Financial and insurance services | -1% | 0% | -5% |
Real estate; professional, scientific and technical activities | -5% | -7% | -11% |
Administrative and support activities | -11% | -12% | -5% |
Public administration and defence | -5% | -5% | -7% |
Education | -3% | -3% | -3% |
Human health and social activities | -11% | -5% | -20% |
Other | -15% | -9% | -10% |
Source: NEF analysis using Understanding Society COVID-19 wave 1; linking to Understanding Society Wave 9 for sector
These findings add to the extensive evidence base that households are experiencing the economic shock of Covid-19 very differently, and that the shock is widening deep-seated inequalities, here highlighted by gender and class divides. Men working in white-collar sectors remain relatively insulated from the economic impacts of the crisis, whilst other workers have seen a loss of earnings. Other research (from the Institute of Economic and Social Research, and in forthcoming NEF research) has highlighted that low-income workers, who are more likely to be Black, Asian or minority ethnic (BAME) are disproportionately affected, and that young people in particular are most likely to have lost their jobs.
The future path of Covid-19’s economic shock will depend largely on government choices, including the pace and design of how the lockdown is lifted, as well as the subsequent health impacts of these choices, and whether there is a second wave of infections. As the furlough scheme is unwound and the lockdown partially lifted, it is not a given that our economy will bounce back, or that the unequal impacts of the shock will be reversed.
We need any recovery measures to consciously work to reverse some of these unequal impacts and reorient our economy to ensure that no one is left behind. This will require large-scale and ambitious approaches that support people who have already lost jobs, such as further spending through our social security system to support those who have lost incomes, and large-scale public investment programmes to create new green jobs, when it is safe to do so.
Notes
1. Data used for the analysis is from the Understanding Society Covid-19 study is a monthly survey on the impacts of the Covid-19 pandemic on the UK population, funded by the Economic and Social Research Council (ESRC) and the Health Foundation. The first wave was carried out online between 24 and 30 April. It links to the ongoing Understanding Society survey, the UK Household Longitudinal Survey, which follows tens of thousands of UK households annually to track their socio-economic circumstances and experiences over time. All Understanding Society adult sample members aged 16+ were invited to participate the Covid-19 study, and 17,452 completed the survey in the first wave. For further detail, see here: https://www.understandingsociety.ac.uk/research/themes/covid-19
2. The analysis focusses only on those of working age (18 — 65) who were employed in February, or employed and self employed (ie. it does not consider the unemployed or those who were self employed. We also eliminate those with missing data on key statistics, such as hours worked, earnings, and for whom sector information is unavailable — giving a total sample of 7,504.
3. The Covid-19 study did not contain details of sector worked in, so we have linked back to wave 9 of the Understanding Society survey, which gives data on sector worked in in 2017 – 2019. It might be the case therefore that a minority of people will have moved sectors since then. Individuals were grouped into sectors using high level SIC 2007 codes, and sectors were further grouped to ensure that sample sizes were sufficient (with no group smaller than 50).
4. Results were weighted using the cross weights given in the Covid-19 dataset, which take into account basic demographics, household composition, economic variables and health variables.
Image: Pexels
Campaigns Coronavirus response Living income
Topics Work & pay