Tackling insecure work is vital to any meaningful recovery from crisis
Millions at risk of slipping into low-paid, insecure work as the economy recovers from coronavirus
19 June 2020


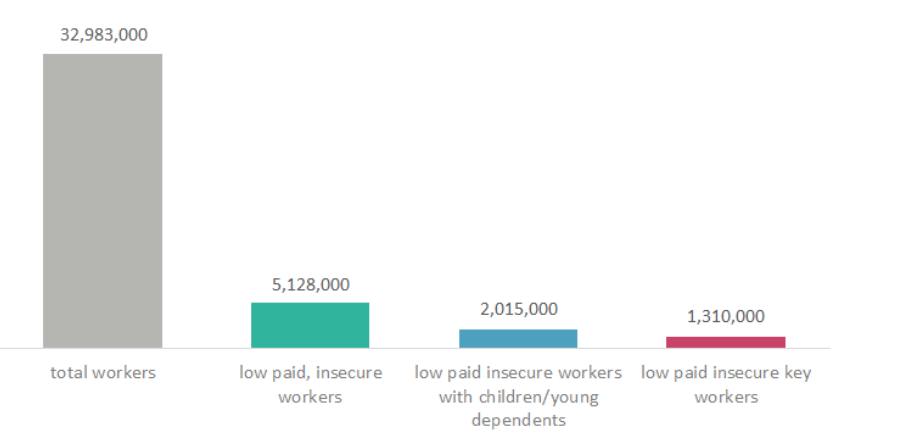
The coronavirus crisis continues to expose the underlying fragility of the UK economy. New analysis by the New Economics Foundation and the Living Wage Foundation shows that while unemployment was near record lows on the eve of the crisis, 5.1 million UK workers were in low-paid, insecure work. Of these, 1.3 million were key workers and two million were parents (see figure 1 below).
Figure 1: An overview of insecure work in the UK, Q4 2019
Focusing on the near record lows in the pre-crisis unemployment rate is misleading when you take into account the prevalence of low-paid, insecure work. This is something that we should remain wary of as we assess the damage done by the crisis and we move towards recovery.
That being said it seems likely that unemployment will markedly rise as we make this transition. The extent to which this is the case will depend on how the government tapers its economic support, how far and how fast social distancing measures are wound down, and on whether there will be a second wave. Data suggests that, despite the government support schemes, many employees have lost work, as the number of payrolled employees fell by over 600,000 in May compared to March. This was accompanied by a sharp 9% fall in hours worked and a 60% drop in vacancies to a new record low.
With the government’s furlough scheme set to be gradually reduced at the start of August and wound up fully after October, large businesses have begun to consult on redundancies and some have already made public announcements on this. Just last week, Centrica — the owner of British Gas — announced it will cut 5,000 jobs, equivalent to a quarter of its UK workforce. Chemicals firm Johnson Matthey also announced that it will cut 2,500 staff, while Heathrow Airport launched a redundancy programme. We expect that these announcements will continue as we approach August 1st, when firms will need to start contributing to the cost of furloughed workers.
While mass unemployment remains a serious and urgent threat, the potential rise of low-paid insecure work should also be concerning. The prevalence of low-paid, insecure work means that households are already less financially secure, with around 30% of low-income households reporting pre-crisis that they could not manage for just one month if they were to lose their main source of household income. Moreover, research also suggests that low-paid, insecure work is even worse for mental and physical health outcomes than unemployment.
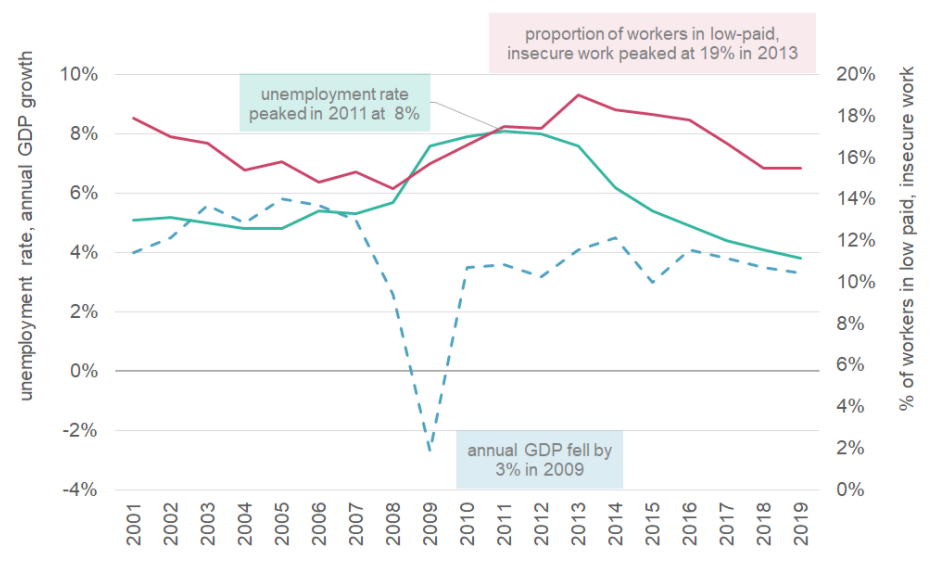
The recovery from the last recession saw a substantial rise in insecure, low-paid jobs. Even though the unemployment rate peaked in 2011 and had fallen to pre-crisis levels in 2015, insecure, low-paid work was more common. In fact, insecurity peaked in 2013 and has remained elevated ever since, as illustrated below.
Figure 2: GDP growth, the unemployment rate (% left hand axis), and the proportion of all workers in insecure employment (% right hand axis), 2001 – 2019
British Airways’ recent conduct is an extreme example of the risk the economy faces as we look to bounce back from lockdown. The firm had already warned of up to 12,000 redundancies — about 30% of its workforce — as it restructures, but now management has threatened that even those that will be kept on will be ‘fired and rehired’ on worse pay and conditions. Our analysis of recent corporate reports suggests across the aviation sector, employers are planning to cut an estimated 27% of jobs in the immediate short-term, i.e. within the next two to three months, due to coronavirus health measures which suppress sector demand. This equates to around 39,000 aviation jobs at risk, and up to 70,000 when supply chains are considered.
With such widespread upheaval on the horizon, it’s important to remember that not all demographics will be affected similarly. Official statistics already make clear that the unemployment rate is markedly higher for people from Black, Asian, or minority ethic (BAME) backgrounds than it is for white people. Recent NEF analysis explains, women and minority ethnic groups are also less likely to be adequately supported if having to rely on Universal Credit.
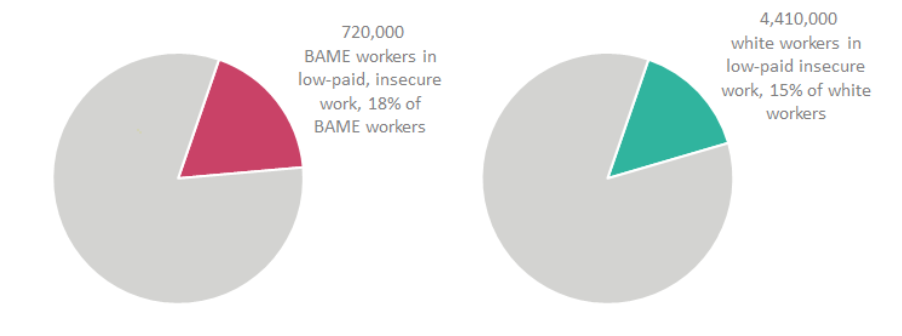
Our research finds that even amongst those with jobs, economic insecurity is more prevalent for those from minority backgrounds than it is for white workers. 18% of BAME workers were in low-paid insecure roles compared to 15% of white workers.
Figure 3: Low-paid, insecure work by ethnicity, Q4 2019
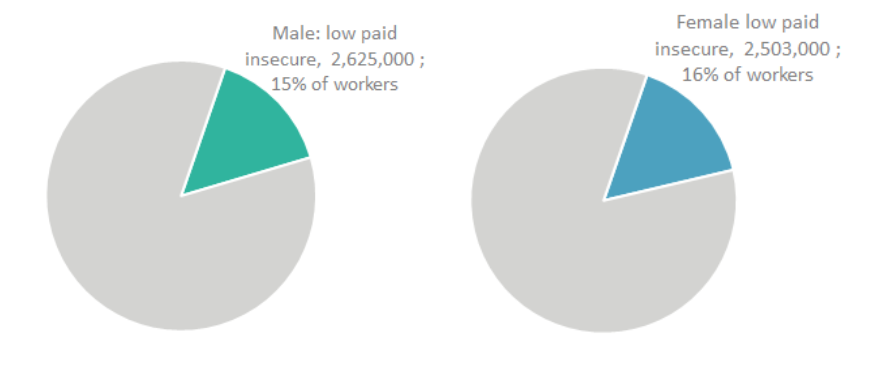
Poorly paid, insecure work is also markedly gendered. Before the crisis hit, female employees were more likely to be in low-paid, insecure roles than their male counterparts, at 11% and 8% respectively. Similarly, 55% of female self-employed workers classified as low-paid and insecure, compared to 46% of male self-employed workers. The difference between the sexes is narrower when both employment types are taken together, as a higher proportion of the male workforce is self-employed. Still, low-paid, insecure work remains more likely for female workers (16%) than male workers (15%).
Figure 4: Low-paid, insecure work by sex, Q4 2019
Given the economic upheaval induced by the crisis, greater protection of workers’ pay and conditions is needed to ensure that even outside of high-profile cases and particular sectors, we prevent yet another precarious recovery. Moreover, with women and ethnic minorities more likely to be in insecure, low-paid work, preventing a further increase as we recover from the current crisis needs to be part of any plan that looks to build back a better economy, and counter structural racism and sexism with it.
Technical note: insecure work
The quantitative research was conducted by the New Economics Foundation based on the fourth quarter (October-December) of data from the Labour Force Survey (LFS), and on the annual Family Resources Survey (FRS) datasets, for the years 2001 to 2019. The LFS was the primary source, including employee earnings and total numbers of people in employment, while the FRS was used to estimate the income distribution among the self-employed. Due to small sample sizes in some demographic breakdowns, some categories were subsequently aggregated or three-year moving averages were used as appropriate.
The estimates of insecure workers include all people with earnings less than the real Living Wage, and who experience insecurity at work which we define in terms of one four characteristics: (1) people in non-permanent work (casual, seasonal jobs, fixed-term and agency) excluding anyone who said they did not want a permanent job; (2) people who self-report volatile pay and hours including those on zero hours contracts; (3) people who self- report constant pay but volatile hours; (4) self- employed people. Living wage rates were estimated by taking the prevailing rate of the real living wage in 2019 (the most recent year for which data was available) and adjusting this level back through time based on the cost of living (consumer price inflation including housing costs) to estimate its real terms value in previous years.
These categories are not mutually exclusive and offer different insights into the types of low paid, insecure work people are experiencing. However, we do not double-count individuals who fulfil more than one criteria. The analysis seeks to measure forms of low paid work where experiences of insecurity and vulnerability are likely to prevail.
Since much of the findings are based on three-month samples from each year, the extent to which they can be considered representative of a full year is limited by any seasonal variation and biases in the data. Sectors that rely heavily on seasonal work, for example ‘Agriculture, hunting and forestry’ will likely see a fluctuation in the nature and composition of their workforces across the year. However, the findings provide a reliable sense of change across time given that the given ‘season’ (Oct-Dec) for enquiry is held constant across years.
Due to the nature of the LFS’ sampling, income questions were not asked of unpaid family workers and those on government training schemes. As a result, any workers in these groups have been excluded from our figures.
Data sources
Office for National Statistics, Department for Work and Pensions, Family Resources Survey (2000 – 01 to 2017 – 18). Available at:https://beta.ukdataservice.ac.uk/datacatalogue/series/series?id=200017
Office for National Statistics, Quarterly Labour Force Survey (Oct-Dec quarters, 2001 to 2019). Available at: https://beta.ukdataservice.ac.uk/datacatalogue/series/series?id=2000026
Image: Paolo Gamba (CC BY 2.0)
Campaigns Coronavirus response
Topics Work & pay