To understand Brexit Britain, use better statistics
Mainstream measures aren't reflecting real life experience
11 March 2017


History will look back on this decade as one of huge social and economic change. The 2011 riots, the splitting open of our two party system with the rise of smaller parties, swathes of people voting against mainstream economic and political advice in the Scottish and European referendums: all speak of a deep sense of alienation, division and kicking back against business as usual.
And yet, if you had been only tracking the UK’s conventional headline indicators you would be forgiven for missing these forces entirely.
GDP has been rising for some years. We weathered the recession without significant effects on unemployment. Even the most traditional measure of income inequality – the Gini coefficient – has steadied out in recent years and is now falling.
With statistics failing to reflect peoples’ everyday experiences of inequality and desperation, is it any wonder that they are so widely distrusted?
One of the reasons the statistics can feel so divorced from peoples’ experiences is that the measures we use aren’t keeping pace with the changes our economy has seen over the past few decades. While our economy has undergone tectonic shifts, politicians and policy makers are rolling out the same stats as they were 50 years ago.
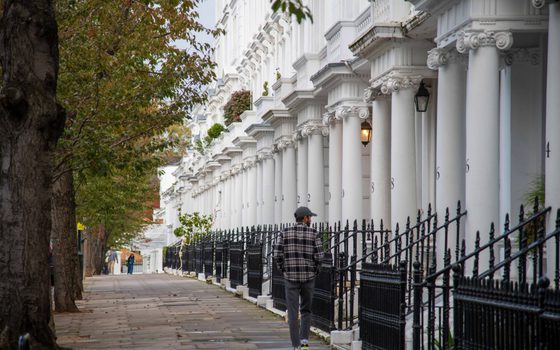
For example, while regional inequalities are a feature of most economies, the scale of recent divergence between London and the rest of the UK leaves us an extreme outlier in Europe. 2017’s prize for the most succinct description of the state of British economics has to go to a woman in Newcastle who responded to economic predictions about the effects of Brexit on GDP with the heckle: ‘That’s your bloody GDP, not ours.’
The blunt measure of unemployment also doesn’t mean much when the majority of those in poverty are now in working families. Combine that with the rise in insecurity, phony self-employment and underwork, and it’s no wonder that leading psychologists and psychotherapists came together last week to write a letter to the DWP highlighting the effect of poor working conditions on mental health.
The widely used measure of disposable income is also disconnected from many peoples’ lived experience. Lower income households have to pay more for the same essential goods such as utilities. They also spend a higher proportion of their income on housing costs, and debt repayments as they have both more debt and higher cost loans. For many people, so-called ‘disposable’ income feels nothing of the sort. Indeed, when taking into account housing costs, the fall in income inequality is much less than it initially seems.
“The blunt measure of unemployment doesn’t mean much when the majority of those in poverty are now in working families”
But, while we need to get smarter about how we use statistics to describe the economy (widespread adoption of our Good Jobs Index would be a start), I believe the crisis in statistics goes deeper than that.
During the months before and after the referendum, I was travelling with colleagues to some of the most deprived wards in the country. The focus of our visits were to support local residents to make changes in their local areas that would give them more control over their lives and improve their health and wellbeing. But the conversations, unsurprisingly, often fell to membership of the EU.
While many of them would have agreed with the heckler in Newcastle that they had not felt the gains of economic improvement, their arguments were not primarily about the economy. More than once I heard people explain that they wanted to leave even if it meant a fall in their incomes. They were voting for something which went beyond their economic concerns,. They were voting for a sense of meaning — a sense of what was wrong with their lives and how they wanted their lives to be
So if we want to understand the currents of dissatisfaction in this country, we need to understand the inequality in how people experience their everyday lives.
This week we published new research with the What Works Centre for Wellbeing which aims to do just that. We report areas of the country which have the highest inequalities in people’s experience of wellbeing, measured by feelings of happiness or anxiety, whether they feel their lives are worthwhile, and the extent to which they are satisfied with the lives they are living. Crucially, these statistics come from people themselves. Rather than pointing to external factors as a proxy for peoples’ wellbeing, subjective wellbeing measures respect that people themselves are the best judges for how their lives are going.

The statistics are able to pinpoint the areas in the country where people feel most left behind compared to others in their communities. Places with high levels of inequality include the Welsh Valleys and areas around Glasgow. Our analysis also suggests that areas with higher inequalities in wellbeing were also more likely to vote Leave in the EU referendum, while neither average wellbeing nor income inequality was a significant predictor.
Later this year, we’ll be exploring what drives inequalities in wellbeing at a local level, and also reporting on research for the Office for National Statistics on which measures of wellbeing inequality are most useful (and if you want to have a say on that, you can fill in this survey).
Our society is changing, and the statistics we use need to change with it. The nature of inequality in the UK is complex, and it may be in the overlapping inequalities cutting across regions, generations and economics that it is most acutely felt. Unless we properly understand these lived experiences of inequality, we won’t be able to address them.
Topics Inequality Wellbeing