GDP per head today is still £128 below 2008 levels
Official GDP per head is demonstrably failing to reflect the true lived experience in the economy
18 September 2019


Official statistics suggest average livings standards returned to 2008 levels in 2015. But when calculated to reflect the true costs of living, NEF analysis has shown that a combination of the depth of financial crisis, austerity and the vote to leave the EU has meant that average living standards are in fact still yet to recover pre-recession levels – by around 1.6% or £128 per head. Outside of Westminster and Whitehall, it’s little wonder most people care more about not having shared in the last recovery, than they do about the chances of the next recession.
This month’s second estimates for the latest GDP statistics from the Office for National Statistics (ONS) are expected to confirm what we already knew. The UK economy underwent a surprise contraction during the second quarter of 2019 for the first time since 2012. Many forecasters are now saying the chances that the UK is already in a Brexit-induced recession are non-trivial.
But there is a danger here that economists and commentators alike are missing the wood for the trees – agonising over whether we’ve fallen back into technical recession while for the majority of people, the lived experience still does not reflect an economy (whether in recession or not) that is working for them.
Probably the most important reason for this oversight is that the official data doesn’t appear to bear out the lived experience. Official estimates show that UK GDP per head returned to 2008 levels more than four years ago, during the early part of 2015 (see Figure 1 below). Even at the level of the UK’s nations and regions, real GDP per head (strictly speaking, it’s GVA at a regional level) has now recovered 2008 levels almost across the piece (although when disaggregated further, some local authority areas are still yet to have recovered).
Figure 1
Official GDP per head recovered 2008 levels during 2015
Index for real GDP per head (ONS chain volume measure), Q1 2005 to Q2 2019, Q1 2008 = 100

Source: NEF calculations using ONS estimates for real GDP per head, ONS chained volume measure (ID: IHXW)
Such discrepancies between evidence and perception have helped fuel increased interest in the efficacy of GDP as a headline economic indicator at all. Indeed NEF has helped lead the way on wellbeing research in the UK with the development of alternative indicators for living standards.
But short of replacing or supplementing GDP wholesale, it is also possible to show that even seemingly superficial elements in the way official GDP is estimated can also radically change the story it tells about the economy.
One important example is the way that economists adjust for inflation. In order to compare the level of income in the economy on a like-for-like basis across time, analysts need to take account of how prices have also changed. Incomes might be higher from one year to the next, but to understand if this translates into higher livings standards, we need to know whether — and by how much — prices may have also moved.
Official estimates for price adjusted (or ‘real’) GDP use a measure of inflation known as the ‘GDP deflator’, which accounts for changes in the costs received by all UK producers (the companies that make goods and services) for their output. This makes sense when trying to understand how ‘domestic product’ or ‘output’ has changed across time (or at least, the portion of output measured in terms of money) – which is the thing that GDP was invented to do in the first place.
Unfortunately, and as economist Simon Wren-Lewis was among the earliest to point out, the GDP deflator also misses many things that might be important to changes in real living standards. This is because domestic output prices exclude things like taxes on value added (VAT) and the prices of imports, which all nonetheless have a very real impact on the prices paid by the end consumer in the UK.
This means that the rate of change in consumer prices can sometimes be quite different to those reflected by changes in the GDP deflator. Figure 2 illustrates the point. Consumer prices have accelerated beyond output prices on two or three occasions in the past 30 years, once during the mid-1990s and again in 2010 and 2016.
Figure 2
Consumer prices have accelerated beyond domestic output prices twice in the past 30 years
Respective indices for output price inflation (GDP deflator) and housing adjusted consumer price inflation (CPIH), Q1 1990 to Q2 2019, Q1 2008 = 100
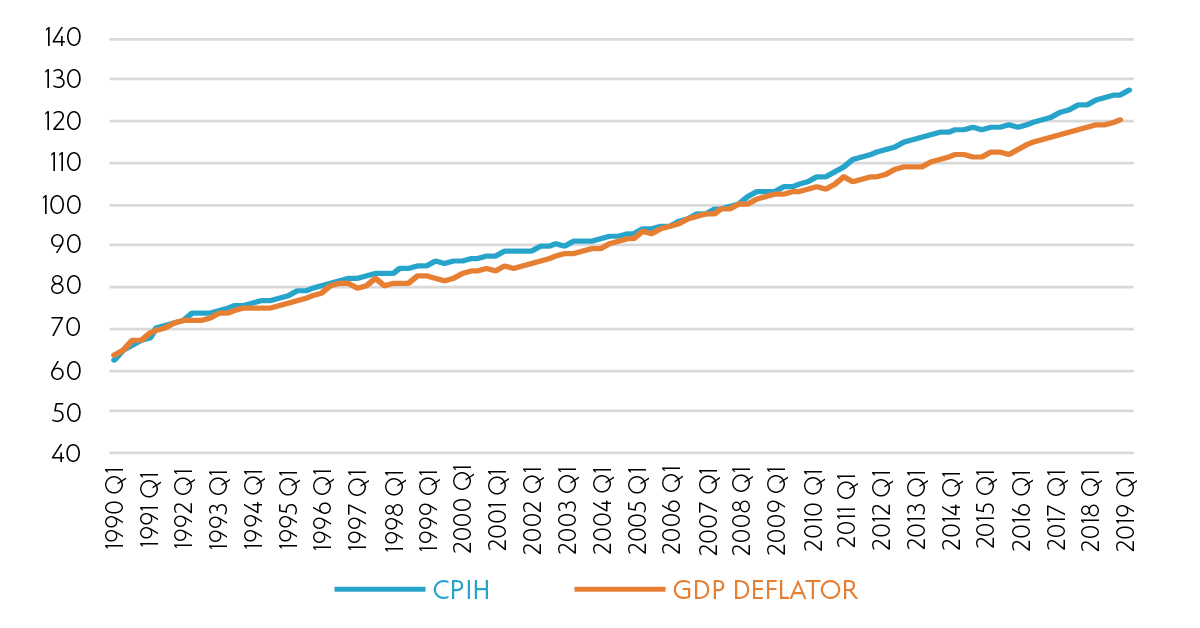
Source: NEF calculations based on ONS estimates for changes in CPIH (ID: L522) and the GDP deflator (ID: L8GG)
Because the UK imports so many of the things we buy on our high streets, the value of the pound can be a key determinant of the difference between consumer and domestic output prices seen above. When the pound is strong in relation to other currencies, imports become cheaper (or at least they get expensive more slowly). But when the pound is weak, the price of imports can rise significantly, feeding through directly into average consumer prices – but crucially not output prices.
Figure 3 below suggests just how important the exchange rate can be to explaining these differences in inflation. It shows that since 1990, a collapsing value of the pound presaged consumer prices outstripping output prices on three occasions.
The first time was after the UK left the European Exchange Rate Mechanism (ERM) in 1992. The second, was after the 2008 financial crisis (although here the UK government’s decision to increase VAT in 2010 and 2011 should also get an honourable mention). The final time was after the vote to leave the European Union in 2016, just as the pound was beginning to show signs of recovery and the gap between output and consumer prices was beginning to close.
Figure 3
The value of the UK pound is an important determinant of the difference between output and consumer inflation
Respective indices for output price inflation (GDP deflator), housing adjusted consumer price inflation (CPIH) and the effective exchange rate of sterling, Q1 1990 to Q2 2019, Q1 2008 = 100
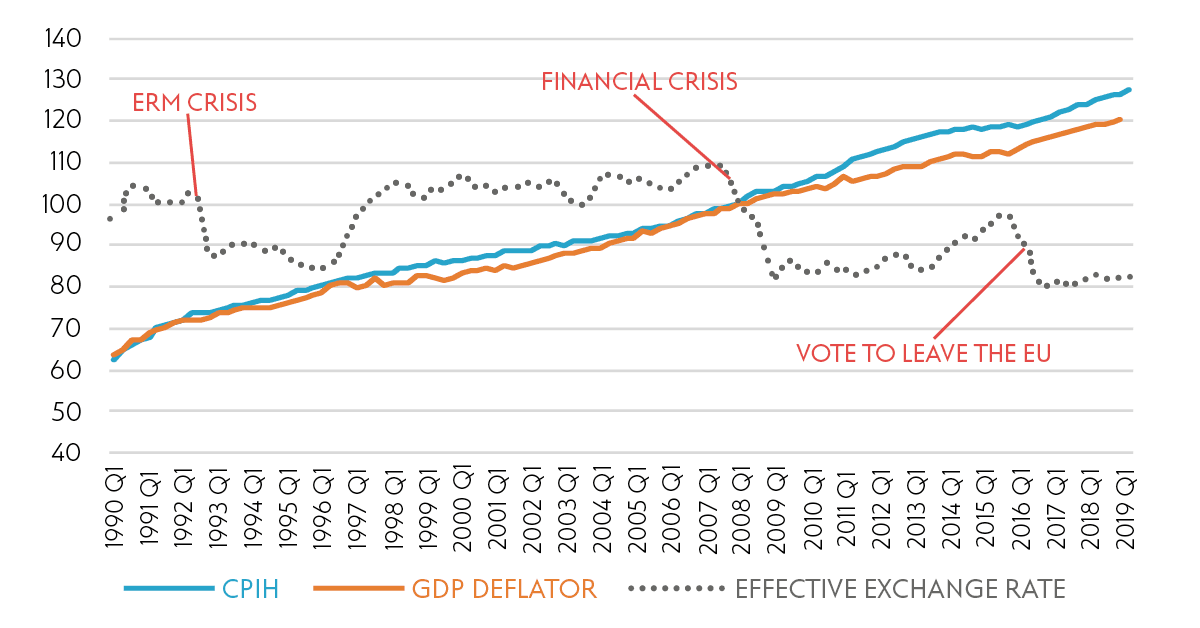
Source: NEF calculations based on ONS estimates for changes in CPIH (ID: L522) and the GDP deflator (ID: L8GG), and Bank of England estimates for changes in the effective exchange rate for sterling (ID: XUQABK67)
So what happens if real GDP is estimated using the lived experience of inflation for consumers, rather than for cost of UK output?
The answer is potentially quite important: when adjusted for consumer prices – the price paid by UK individuals and families – real GDP per head has yet to recover 2008 levels (see figure 4 below). By this measure, and on average, the UK population is still 1.6% poorer than it was more than a decade ago, equal to £128 per person – something that is entirely unprecedented in the modern records, no matter what measure of inflation is used.
Figure 4
When estimated using consumer prices, real GDP per head has yet to recover 2008 levels
Respective indices for real GDP per head, one computed using the GDP deflator (ONS chain volume measure) and the other using consumer price inflation (CPIH), Q1 2005 to Q2 2019, Q1 2008 = 100
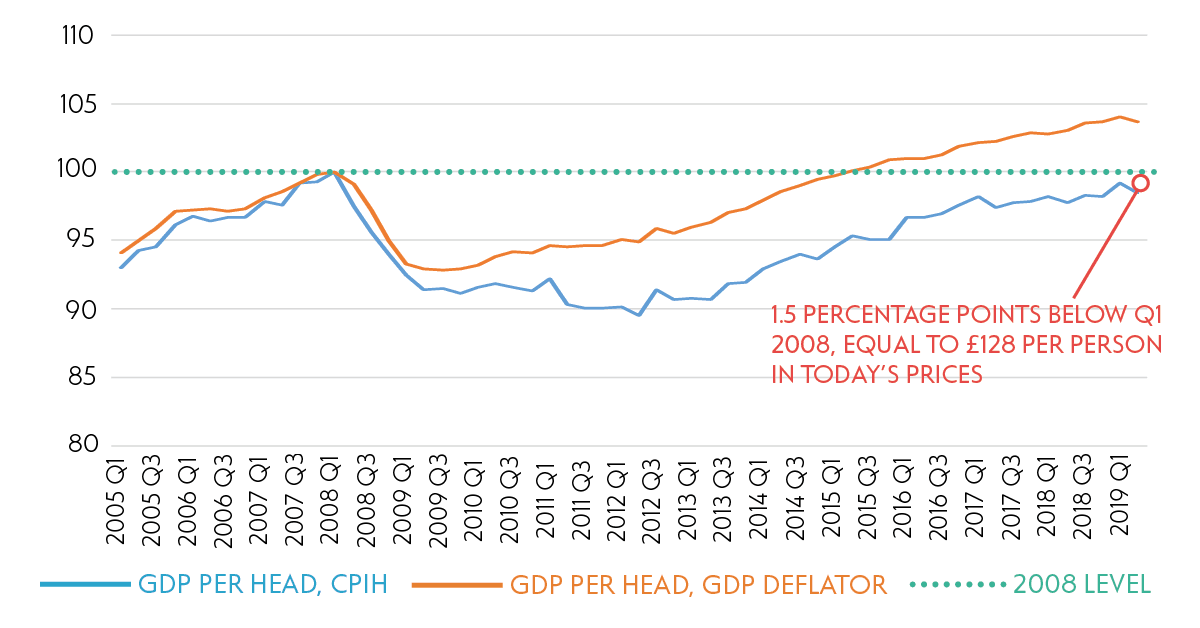
Source: NEF calculations using ONS estimates for CPIH (ID: L522), nominal GDP per head (ID: IHXT) and real GDP per head, ONS chained volume measure (ID: IHXW)
It’s important to note that inflation is not the primary reason why real GDP per head (by any measure) has recovered so slowly since the crisis. The magnitude of economic shock in 2008, and the size of recession that followed was larger than anything experienced by the UK economy since the 1930s Great Depression.
Just as important was the policy response of austerity after 2010, the isolated effects of which suppressed the UK economy by up to a further 4.7% (or £100 billion) by 2018/19 – and with the harmful effects most concentrated for those reliant on local government services and working age social security. During the two years following the 2016 vote to leave the European Union, continued uncertainty about the UK’s trading future is also thought to have cost the economy a further 2% (or £40bn) in the year to March 2019.
The effects of different inflation metrics, however, can be the difference between whether the official evidence accurately reflects today’s lived experience of these policies and events. Or indeed, the difference between average living standards supposedly recovering 2008 levels, or not.
Over the past 10 years, it’s no coincidence that average real earnings have proved a far more accurate barometer than GDP for the experience of the average UK household, estimated as they are using consumer prices in the official statistics. The fact that real earnings have seen their slowest recovery in almost 200 years tells its own story.
But while GDP continues to serve an ill-advised, dual role as both a technical measure of domestic output, in addition to a lazy person’s catch-all for just about everything else, the quality of our economic debate will continue to suffer.
This is of far more than just academic concern. The current political turmoil has distrust in technocracy and ‘expert’ views at its core. Matters won’t be helped by the media fretting and obsessing over the likelihood of another recession, when the average person has yet to even recover from the last one.
Topics Macroeconomics