Government attempts to ‘live within its means’ encourages UK households living beyond theirs
NEF analysis of the latest stats reveal another hidden cost of austerity
29 March 2019


Many of the human impacts from austerity are clear for all to see. Rising homelessness, threadbare local services and an overstretched NHS are too often self-evident. More recently, NEF analysis has also revealed the direct cost to the economy as a whole: worth £100 billion in lost GDP in 2018 alone or £1,500 for every adult and child in the UK. But there is a potentially more hidden cost to austerity that only becomes apparent when you look under the bonnet of the economy: an unprecedented build-up of unsustainable household debt.
The government patted itself on the back earlier this month for inching closer to a balanced public budget. But new Office of National Statistics (ONS) stats released today show British households had spent on average around £870 more than they earned during 2018, amounting to a £23.5 billion deficit for the household sector as a whole for 2018. This is the second highest household deficit on record. And it’s not unrelated to government efforts to reduce its own deficit.
Figure 1: UK household sector second highest household deficit on record
Net balance of UK households sector, compared with other sectors of GDP, 1987 to 2017 (current prices £billions)
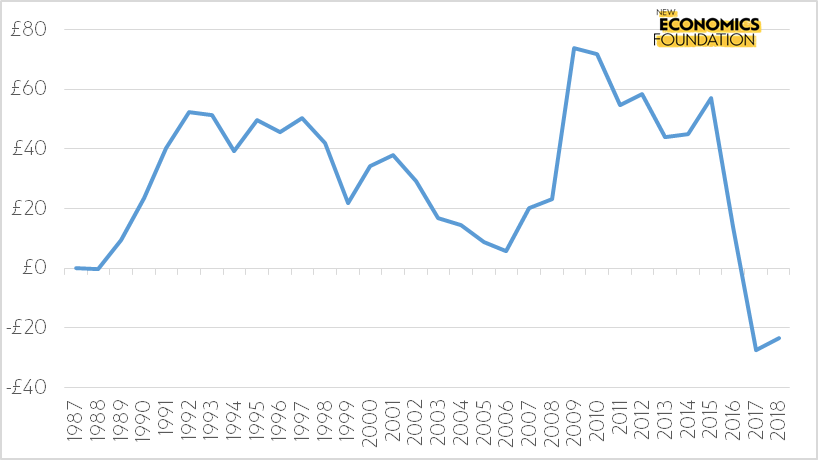
Source: ONS Quarterly Accounts
The economy is made up of different sectors. One framework, known as the sectoral balances framework, divides it up into: households, corporates, government, and the foreign sector (and sometimes the corporate financial sector). This framework provides a macroeconomic lens for analysing the surplus and deficit relationships between these sectors. It is derived from a national accounting identity that specifies the relationship between aggregate spending and income. In this respect, sectoral balances are not some form of economic theory, but they the product of simple mathematics.
Consequently, the combined financial balances of these sectors (their surpluses and deficits) must always sum up to zero. This means that if the government’s deficit declines, the sum of deficits of other sectors of the economy (households, firms and the ‘rest of the world’) must increase by the same amount. With government attempting to reduce its deficit at a rate of knots and the ‘rest of the world’ maintaining a perennial surplus, it follows that corporate and household borrowing must therefore rise.
Figure 2: Households have become net borrowers since Q4 2016
UK sectoral balances as % of GDP for government, household, non-financial corporate, financial corporations and external sector, 2000 Q1 to 2018 Q4
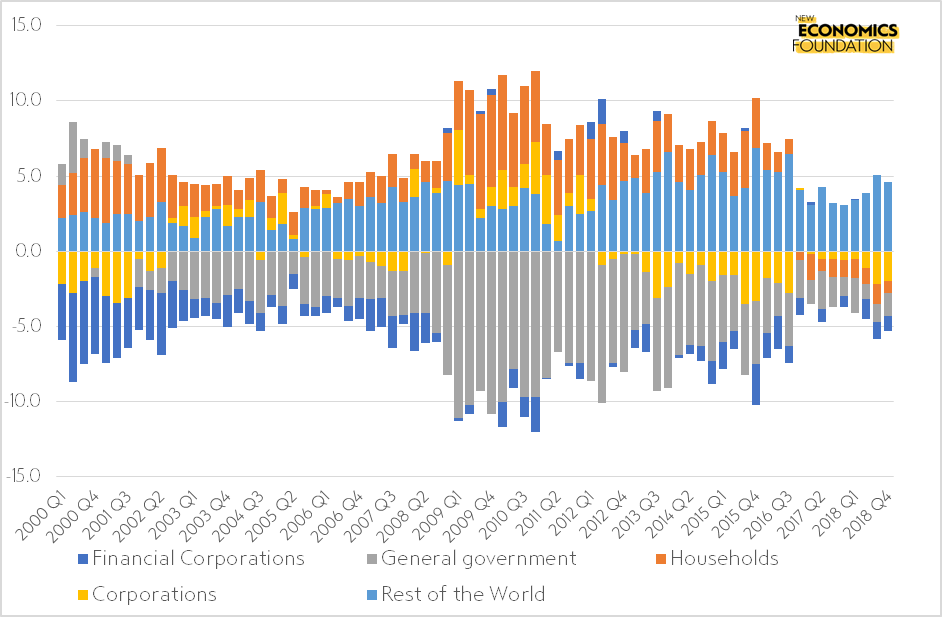
Source: ONS Quarterly Accounts October to December 2018
In the UK there is a strong link between government cutbacks on spending to reduce the deficit, and rising household indebtedness (Figure 3). Since the start of the 2010 austerity programme, the household sector’s surplus has decreased over time, until reaching a deficit position at the end of 2016. The falling surplus meant that households were accumulating net financial assets at a slower rate, while the movement into deficit implies that households have been running down their net assets.
Figure 3: Strong correlation between government and household balance sheet positions
UK government and household sectoral balances,% GDP, 2000 Q1 to 2018 Q4
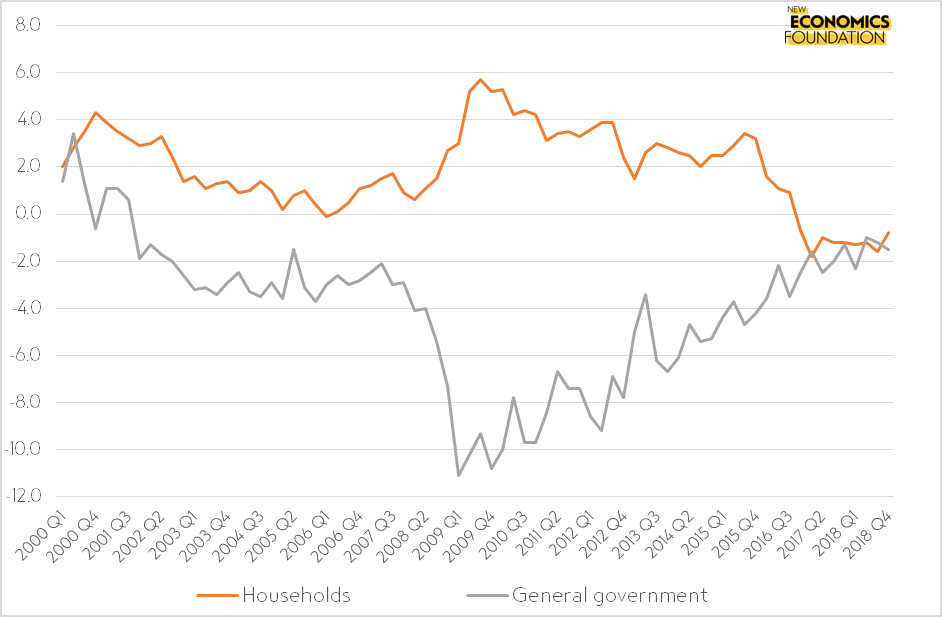
Source: ONS Quarterly Accounts October to December 2018
The sectoral balances approach, however, is not without limitations. For one, it relies heavily on aggregates. For example, we know that the part of the corporate sector that is in deficit is in fact largely driven by micro firms (very small businesses). Though legally incorporated, economically these organisations have more in common with household budgets than with medium and large firms who have remained in net surplus.
An even more important issue is that sectoral balances can be misinterpreted. This is because they only tell us something about what is happening between sectors, rather than within. Much of growth in overall household debt is the result of households lending more to each other (mainly intermediated through the creation of credit by banks). A measure of gross debt therefore better captures the lived experience of families in terms of their overall debts to one another as well as other sectors. Today’s NEF analysis shows that from 2014 to present, total consumer debt per person rose from £4,100 to nearly £6,320 (Figure 4). This debt has also grown much faster than household incomes, and at 38.2%, is now higher than before the global financial crisis.
Figure 4: Consumer lending 2018 is now far higher than before 2008
Total unsecured lending per person, both in cash (£ current prices, left hand axis) and as a proportion of gross disposable income (%, right hand axis), 2001 Q1 to 2018 Q4
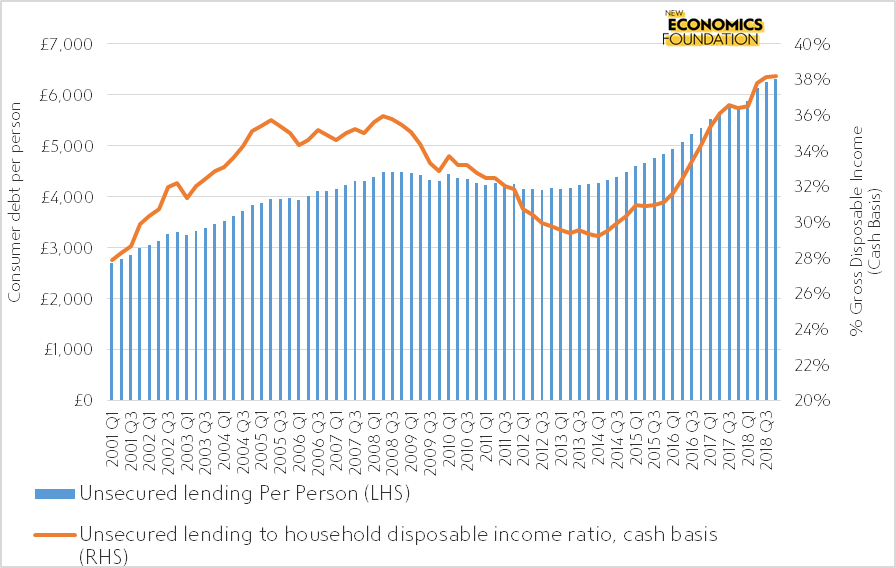
Source: Author’s own calculations based on ONS Quarterly Accounts October to December 2018
While household debt can rise or fall irrespective of the government’s balance sheet, all else being equal, a decrease in government deficits is nonetheless still likely to add pressure on households – such as by lowering disposable incomes through benefit cuts or reduced public sector pay. Furthermore, when the government cuts back the economy needs households to increase spending in order to maintain overall demand.
Within the household sector itself, there is also good reason to believe that the increased debt burden for families has not been shared equally. As welfare payments and funding for public services have been cut back, low income families have increasingly had to take out proportionately more debt. The graph below shows that the change in consumer debt has mainly been born by the lowest income quintile: a finding that is further supported by recent work by Professor Jo Michell.
Figure 5: The consumer debt burden has grown fastest for the lowest income households
Change in consumer debt as a proportion (%) of gross household disposable income, for equivalised income quintile, 2015 and 2017
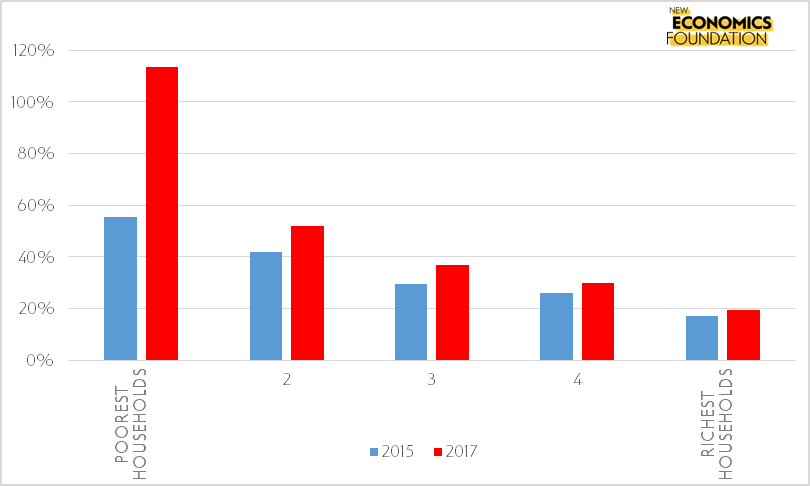
Source: Centre for Responsible Credit Calculations based on Bank of England NMG Survey 2015 & 2017
Government spending cuts have been enacted in the name of ‘balancing the budget’ and ‘living within our means’. But the outcome has been an unbalanced economy that has forced many UK families to live well beyond their means – yet another consequence of the failed experiment in austerity.
Topics Public services Inequality