A radically different social security system
How we can start to rebuild the incomes of the UK’s lowest paid families
12 November 2019


By Alfie Stirling, Sarah Arnold and Lukasz Krebel
Building on our proposal for a ‘Weekly National Allowance’ (WNA), NEF have been looking into how a new, unconditional weekly payment could be integrated with Universal Credit (UC) to create a transformative new system of social security. Introducing a WNA makes true reform of UC possible. We show how UC could be changed beyond all recognition, and how this can be paid for: reducing inequality, ensuring people aren’t penalised for working, and lifting hundreds of thousands of families and children out of poverty.
Universal Credit has become the exemplar policy failure. The programme is more than half a decade late, eye-wateringly over budget and peppered with unforeseen design flaws, which have incurred criticism from whistle-blowers and acute hardship for those it is supposed to support. More serious still, the actual design of UC fails against its own objectives of reducing costs and improving work incentives. No major political figure, from the front bench of any political party, seems prepared to champion the policy. Reform, it would seem, is inevitable.
Yet despite damning criticism from across both the political spectrum and independent observers – from the National Audit Office to the UN – we now find ourselves less than 6 weeks from a general election and far too little work has been done on the detail of how to fundamentally restore an effective, progressive safety net.
As things stand, the government remains committed to UC, at least by default. But while opposition parties have talked up a range of alternative courses of action, the clarity and detail that sits behind bold promises is still lacking.
The Labour Party have announced an important emergency package that would certainly reduce poverty and hardship. But beyond stressing important new principles of dignity, universalism and ending poverty, there is no further detail behind their much wider commitment to ‘scrap’ UC entirely.
Both the SNP and Liberal Democrats have announced their intentions to retain but reform UC, yet neither have shown how the sum total of their proposed adjustments would justify rhetoric of ‘radical change’. Nor have they committed themselves on all of the details yet, nor how it might be funded.
This is a problem, not least because even small changes to UC can incur costs that are non-trivial. For example, reducing the so called ‘taper’ – the amount of UC income that is withdrawn for every £1 of earnings from work above a certain threshold – by just 1p costs around £500 million. Meanwhile the Green Party continues to call for a complete overhaul with a wholesale move to a so called ‘universal basic income’ (UBI), but the policy detail is still yet to be set out.
Over the past 9 months at NEF, however, we have also been turning our attention to the question of how UC might actually be overhauled in practice. In doing so, we have been building on our proposal for a Weekly National Allowance (WNA), published earlier this year.
The WNA would see the personal allowance of income tax replaced with a new, unconditional payment equal to the annual value of income tax that would otherwise be paid on the first £12,500 of earnings (£2,500 per person or just under £50 per week). This payment would be made to all adults with a national insurance number but would be tapered away for those earning more than £100,000, just as the personal allowance is today. Figure 1 below sets out the distributional effects for all adults if the WNA were to be implemented in the current financial year.[i]
Figure 1
Post-tax incomes would either rise or stay the same for 87% of adults, with the 13% highest income adults paying for a redistribution to the poorest 42%
Distributional effects of the Weekly National Allowance within the tax system only (including the new weekly payment but before taking into account means-tested benefits): change in post-tax income by percentiles for gross income, 2019/20
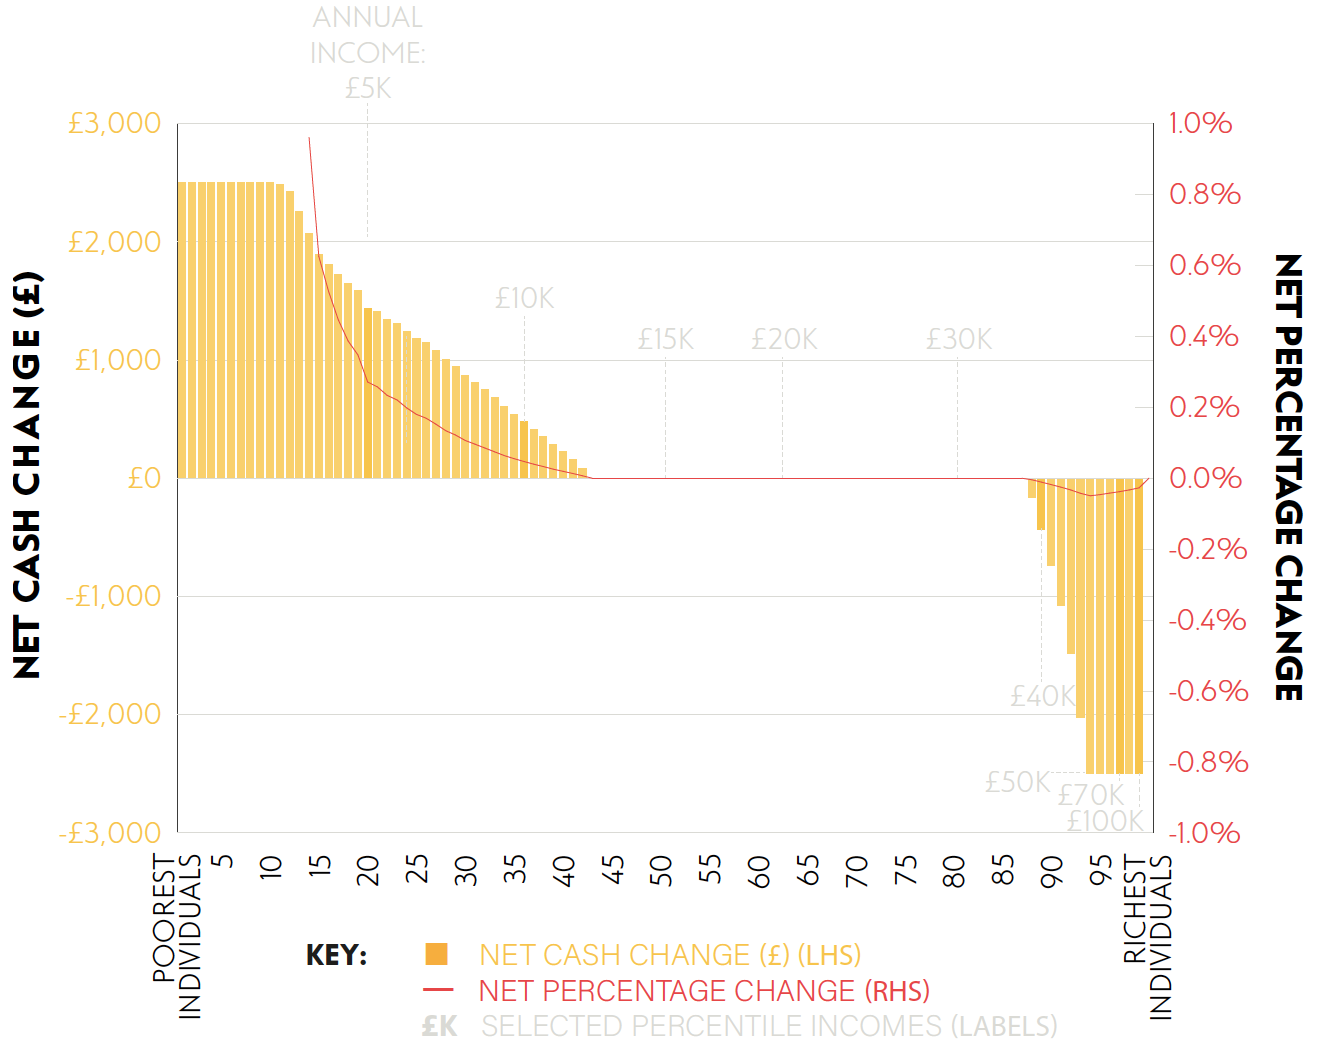
Source: NEF analysis using the IPPR tax and benefit model based on data from the ONS and OBR (various) and the 2016/17 Family Resources Survey
NB: we do not report values for the series ‘net percentage change’ below the 14th percentile because incomes below this level are either nil or negligible
Our full paper and final recommendations, including both updates to our original WNA proposal and significant reforms to UC, will be published in the coming months. But we believe one finding to be of particular interest.
The key insight is that because the WNA would be included in the means-testing regime for UC (scored in the same way as earnings from work), it would effectively displace around 29% of UC once the latter is fully rolled out. As the evidence from our March 2019 report shows, this still leaves families in receipt of means-tested benefits far better off overall and on average (Figure 2 and Appendix 1 below).[ii] But it means the standalone cost of UC would be around £16 billion lower (2023/24).
Not only does this mean that the Weekly National Allowance has significant standalone benefits of its own – including lifting 200,000 families out of poverty and strengthening the UK’s safety net in response to a future recession, while still being fiscally neutral overall – but significant further reforms in UC also become a great deal less expensive for any government that has already adopted a WNA. So much so, in fact, that reforming UC beyond all recognition becomes genuinely affordable.
Figure 2
The Weekly National Allowance redistributes around 8bn annually from the 35% highest income households to the remaining 65%, with gains and losses concentrated at the respective extremes of the household income distribution
Distributional effects of the Weekly National Allowance: change in disposable family income before housing costs across percentiles for equivalised household income, 2019/20
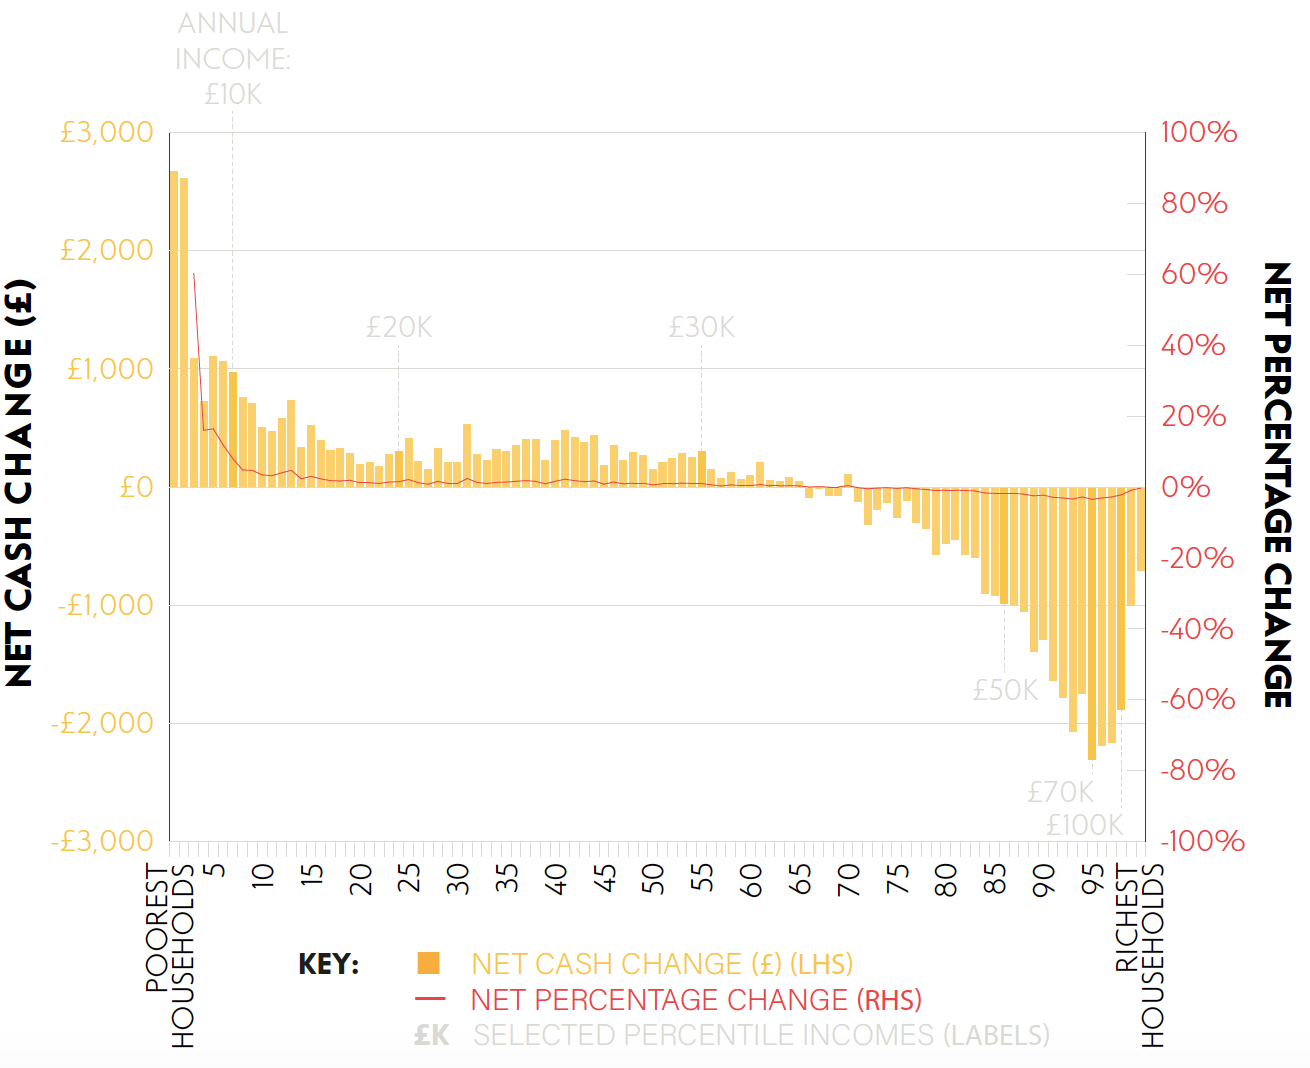
Source: NEF analysis using the IPPR tax and benefit model based on data from the ONS and OBR (various) and the 2016/17 Family Resources Survey NB: We do not report values for the series for ‘net percentage change’ below the 3rd percentile because incomes below this level are extremely small or negative
Figure 3
The total cost of Universal Credit falls by 29% once the WNA has been implemented, but UC recipients are better off overall
Total Universal Credit spending on current recipients of UC, before and after introducing a Weekly National Allowance, 2023/24 prices
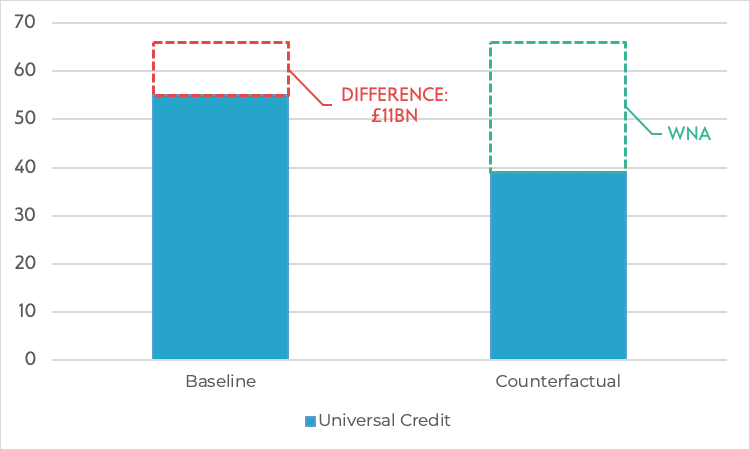
Source: NEF analysis using the IPPR tax and benefit model based on data from the ONS and OBR (various) and the 2017/18 Family Resources Survey
Our work to date has focused on how UC might be reformed so that the WNA and a new system of means-tested benefits might complement each other to maximum effect. For example, although the lowest earners (especially second earners) would be better off overall after implementing a WNA, one of the initial trade-offs this creates is weaker financial incentives to enter or increase work, since the marginal tax rate on additional hours of work for incomes below £12,500 would be 20 percentage points higher after personal allowance of income tax has been removed.
A focus of our research, therefore, has been on improving financial work incentives in UC by allowing people to keep far more of their benefits for longer, both after moving into work and as their pay increases. Alongside this we have also been looking to strengthen support for families with children, since the WNA on its own tends to lift more families without children out of poverty than those with children.
The key elements of supporting families in work are both the ‘taper’ rate at which UC payments get withdrawn for every £1 of earnings and the so called ‘work allowances’ – the amount that an individual can earn before the taper rate starts to take effect. Currently, only households with children receive a work allowance, and there is only one work allowance per household, which means second earners are especially penalised after moving into work.
The most important elements of UC for families with children is the two-child limit, which caps the child element of UC to just two children; and the benefit cap, which tends to mainly effect large families with multiple children and high housing benefit costs.
The table below shows how the cost of relevant major reforms to UC would fall after implementing the cost neutral WNA.[iii] The lower costs for increasing the generosity of the taper rate and work allowances in particular mean that UC can be reformed to help more people keep more of their payments in work, helping to ensure that work pays. For example, further stress-testing in our modelling found that the higher marginal tax rate for earners created by abolishing the personal allowance can be reversed entirely for many households on UC at a cost of around £2 – 3 billion.[iv] Adding extended work allowances to these reforms would effectively restore a significant portion of the personal allowance to many of the UK’s poorest households, on top of their WNA payment and at a fraction of the cost to government of the original, highly regressive personal allowance of income tax.[v]
Across the piece, and after implementing a WNA first, it becomes affordable to reform UC beyond all recognition at a cost of around £10 billion per year: reducing inequality, ensuring people aren’t penalised when progressing in work and lifting hundreds of thousands of families with children out of poverty.[vi] The cost of the same reforms without introducing a WNA would be almost double.
Table 1
The costs of important reforms to UC become up to 60% less expensive once a WNA has been implemented
Cost (£ million, 2023/24 prices) of respective reforms to UC (relative to the Office for Budget Responsibility’s score scenario) before and after (respectively) the implementation of a Weekly National Allowance, 2023/24
Policy |
Without WNA |
With WNA |
Difference |
|
Cash |
% |
|||
Remove benefit cap |
400 |
200 |
200 |
50.0 |
Remove 2 child limit under Universal Credit |
1,900 |
1,900 |
100 |
- |
Reduce taper rate of Universal Credit by 1p |
500 |
200 |
300 |
60.0 |
Extend work allowance for couples to cover second earner |
5,100 |
3,800 |
1,300 |
25.5 |
Expand work allowance to all |
300 |
200 |
100 |
33.3 |
Source: NEF analysis using the IPPR tax and benefit model based on data from the ONS and OBR (various) and the 2017/18 Family Resources Survey
NB: Figures have been modelled in 2023/24 when UC is expected to be fully rolled out. All costs have been rounded to the nearest £100 million and give the effect of changing a single policy in isolation. All work allowances are uprated to 2023/24 values in line with forecasts for CPI. Work allowances for households without children are restored to the same level (as a proportion of existing work allowances) as in the pre-2015/16 designs of UC. Second earner work allowances are set at the same level as current first earner work allowances, and the combined work allowance is applied to the household as a whole. This is therefore likely to be an upper bound estimate of the true cost of a second earner work allowance.
While representing an increase in public spending that is not insignificant, such reforms would still be well within the bounds of affordability – indeed it comes to less than the £13 billion of spending commitments made at the September 2019 Spending Round. And as previous NEF analysis has shown, it is also far less than the cost of tax cuts that have been proposed by Boris Johnson since Theresa May stood down as leader of the Conservative Party.
Nonetheless, and in the long run, we would propose that spending commitments of this size are matched by increases in progressive taxation. A number of options are available, from restoring corporation tax to internationally comparable levels, to replacing inheritance tax with a more progressive gift tax.
Improvements to the taxation of income could also raise revenue in a way that sees the richest households contributing proportionately more. One option would be to tax income from wealth – which is even more unequally distributed than income – at the same effective rate as we tax earnings from work (capital gains, dividend income and savings income all currently receive preferential tax treatment compared to income from work). A further progressive reform would be to replace income tax and employee Nation Insurance contributions with a formula based income tax, and introducing a flat rate relief on pension contributions. Our analysis has found that just one or two of the reforms above would be sufficient to raise the necessary funds.
Changing the way people are taxed and who pays is always a political challenge. In the current context, the Conservative’s commitment to lowering taxes, especially while promising more public spending, is likely to ultimately prove as politically problematic as promises by Labour, the Liberal Democrats and the Green Party to increase taxes in their 2017 manifestos.
The key is to make changes fair, increasing the rate of tax on higher earners who have a lower effective tax rate and decreasing it for those on lower incomes. But it is worth noting that options like a formula-based income tax and flat rate pension tax relief could also lower the tax bill for many low and middle income households, while still raising significant additional revenue. The question then remains, where in the income spectrum do people start to have to pay more?
Labour’s manifesto rule from 2017 stops increases in income tax to anyone outside the richest 5%, which the party say is those earning above £80,000 per year, which is a very high income by anyone’s standards. However, Labour’s calculation was based on HMRC data for all income tax payers, and was therefore skewed towards higher incomes compared with other data sets because it does not include adults with no taxable income or with taxable income below the current personal allowance of income tax.
As Table 2 below shows, the 95th percentile actually varies according to who you include in the data. It starts at around £56,000 for all adults, £61,000 for working age adults and £70,000 for all adults in work (see Appendix 2 for the full distribution).
Table 2
Incomes for the richest 5% of individuals starts at around £61,000 to £78,000, depending on the population group
Distribution of pre-tax income for all adults (those aged over 16), working age adults (those aged between 16 and 65) and working age adults in work, selected percentiles, 2019/20
All adults |
Working age adults |
Working age adults in work |
|
Median |
15600 |
17300 |
22900 |
Top 25% |
27700 |
30400 |
35800 |
Top 10% |
44200 |
47900 |
54600 |
Top 5% |
61400 |
66500 |
77600 |
Top 1% |
133100 |
151800 |
175400 |
Source: NEF analysis using the IPPR tax and benefit model based on data from the ONS and OBR (various) and the 2017/18 Family Resources Survey
All parties are now proposing increases in public spending and, as they flesh these out in the coming weeks, they should also think carefully about the detail of significant changes needed to Universal Credit. The test now is whether politicians will do the right thing and help rebuild the incomes of the UK’s lowest paid families, and in a way that also helps to support them back into work if they choose. In combination, we think our proposals for a Weekly National Allowance and wholesale changes to Universal Credit are a strong starting point for a radically different social security system.
[i] This analysis on individuals excludes the increase in child benefit as well as any further interactions with means-tested social security payments such as in UC
[ii] The modelling assumes the full roll-out of UC, so it can also be taken as a proxy for the long run effects of a WNA as well
[iii] The items in Table 1 have been modelled in isolation from one another. Combined costings will not necessarily be equal to the sum of different items. For example, interactions between the benefit cap and the child limit mean that abolishing both at the same time (in a world without the WNA) would cost around £300 million more per year in 2023/24 than the combined cost of doing each in isolation.
[iv] Because the basic rate of income tax is applied to gross income and the taper rate is applied to post-tax income, a reduction in the taper rate of around 10 percentage points fully offsets the marginal effects of the basic rate of income tax for those in work and in receipt of Universal Credit.
[v] There are three main reasons why the personal allowance of income tax benefits richer households proportionately more than poorer families. First, families with no taxable income, who make up the majority of the UK’s poorest households, miss out on the benefits by definition. Second, families with two or more people receiving a taxable income – which tend to be higher up the income distribution on average – receive twice the benefit or more compared with single earner households. On top of this, the personal allowance is also worth double for individuals with pre-tax incomes above the ‘higher rate threshold’ – the level beyond which additional income gets taxed at a rate of 40%, and set at £50,000 for 2019/20. This is because the higher rate threshold is defined as a specified amount above the personal allowance, so the threshold rises pound-for-pound automatically for any increase in the allowance. However, gains for the richest 5% of households are limited by the fact that the personal allowance is gradually withdrawn for personal incomes above £100,000
[vi] NEF’s forthcoming paper later this year will set out the details of our final reform package, but includes lowering the taper rate significantly and extending entitlement to a work allowance.
Appendix 1
Under the bonnet, the Weekly National Allow more than offsets the lost means-tested benefits for the poorest households
Disaggregated distributional effects of the NEF Weekly National Allowance: Change in disposable family income before housing costs across percentiles for equivalised household income, 2019/20
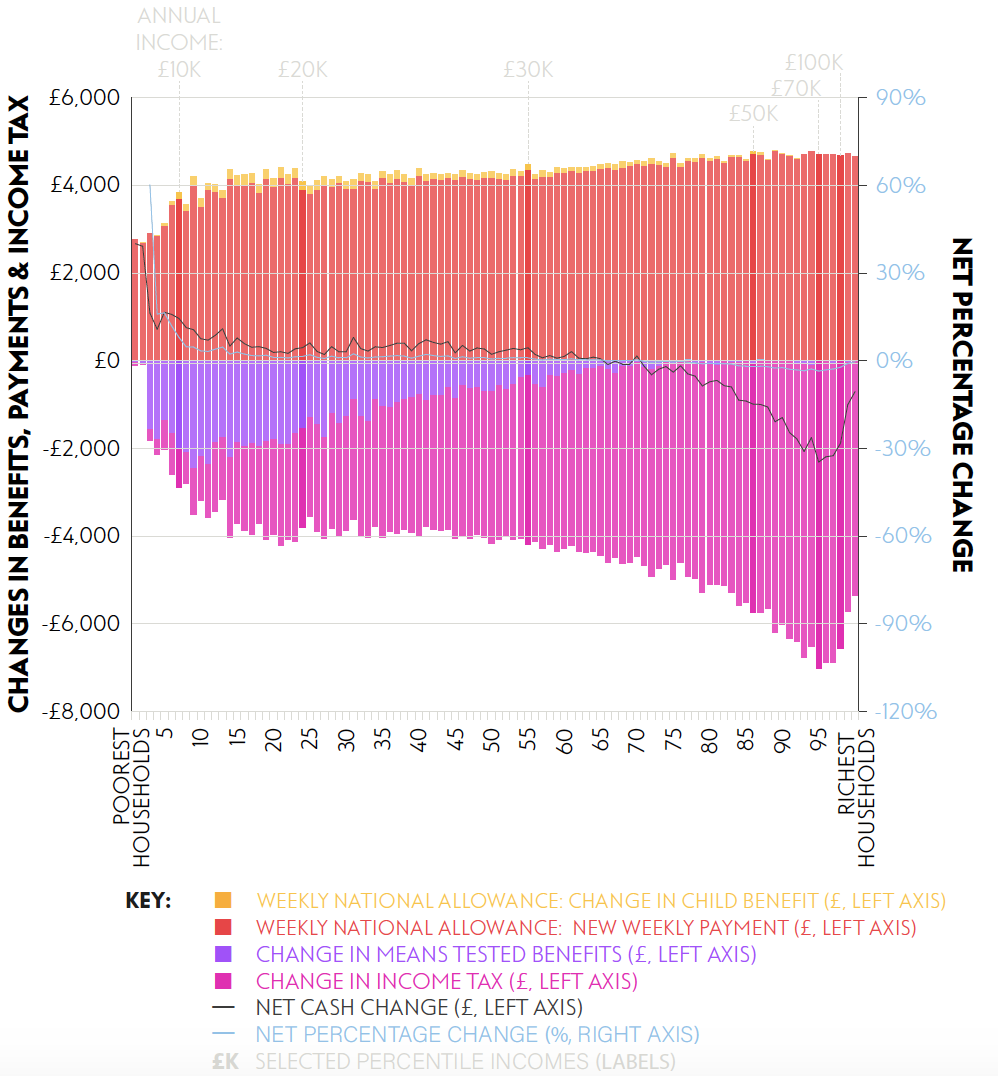
Source: NEF analysis using the IPPR tax and benefit model based on data from the ONS and OBR (various) and the 2016/17 Family Resources Survey
NB: We do not report values for the series for ‘net percentage change’ below the 3rd percentile because incomes below this level are extremely small or negative
Image: Pixabay
Topics Work & pay Macroeconomics