Number of homes insulated through government’s landmark schemes drops 40% in a single year
Government schemes have delivered just 16% of insulation measures needed to meet UK climate commitments
26 January 2024


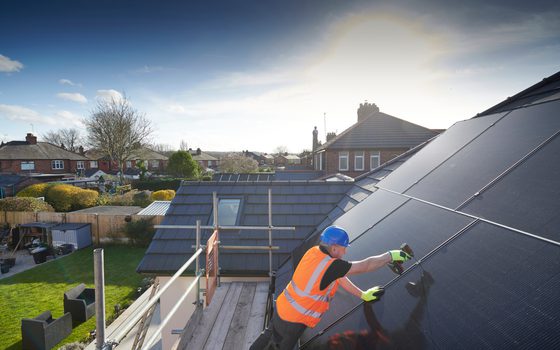
The number of homes which have been upgraded through the government’s landmark insulation schemes has dropped around 40% in a single year, according to analysis from the New Economics Foundation (NEF), out today. The analysis finds that as of last year, the government’s four leading schemes only installed 15.8% of the home energy efficiency measures needed by the end of 2023 to meet the UK’s net zero climate commitments.
Previous NEF research has found that insulating the nation’s draughtiest homes would save households £6.4bn a year on their energy bills. But today’s analysis finds that the total number of households upgraded by the home upgrade grant (HUG) and local authority delivery (LAD) schemes has fallen by 40% in the last year. Similarly, the number of households upgraded under ECO – the largest and longest running scheme – has fallen by 55% over the past year. The social housing decarbonisation fund (SHDF) has existed for less than two years so it is not possible to compute equivalent figures but it is also down 41% quarter on quarter.
Home energy efficiency measures are a key component of the UK’s policies to cut carbon emissions to net zero by 2050. According to the government’s own climate advisors, the UK should have installed around 2,940,087 insulation measures between 2020 and the end of 2023. Today’s analysis shows a massive gap between these targets and reality: just 464,982 energy efficiency measures have been installed since 2020 across the government’s landmark schemes (LAD, HUG, ECO and SHDF). These represent just 15.8% of the installation measures needed.
According to the English Housing Survey, just 53% of homes have cavity or solid wall insulation, and only 48% are rated EPC A to C. UK homes leak heat three times faster than our European neighbours, according to Tado, and private rented homes are particularly affected.
Christian Jaccarini, senior economist at the New Economics Foundation (NEF), said:
““We’re in the midst of yet another winter where people are agonising over whether to turn on their heating, because of the sky-high cost of energy bills. The energy crisis should have been a wakeup call for the government to subsidise basic insulation measures in the UK’s draughtiest homes, as a way to keep bills down for good. Instead, we’ve had a piecemeal approach, and today we’re seeing the results: a drop in government-supported home insulations, when they should be accelerating.
The result is eye-watering energy bills for yet another winter. The government needs to step up its game with a genuine mass insulation scheme and investment in training so we have a well-paid workforce ready to upgrade the nation’s homes.”
Notes
The New Economics Foundation is a charitable think tank who are wholly independent of political parties and committed to being transparent about how it is funded.
Last year’s data has not yet been fully released. We’re missing the final 3 months of the year for ECO and the final month for SHDF, LAD, and HUG. Still the additional data will make little difference to the overall picture. We have imputed the last 3 months of the year based on the average installations observed over the previous 9 months.
The annual change in LAD and HUG installations are calculated using installations in the year to November 23 compared to the year to November 22. Available here: https://www.gov.uk/government/collections/green-home-grant-statistics
The annual change in ECO installations are calculated using installations in the year to September 2023 compared to the year to September 2022. Available here: https://www.data.gov.uk/dataset/1656fb7d-1ca3-462d-a11b-8078acc33275/household-energy-efficiency
The quarterly change in SHDF is calculated comparing installations in the Sep-Nov 23 period to Jun — Aug 23. Available here: https://www.gov.uk/government/statistics/social-housing-decarbonisation-fund-statistics-january-2024
English Housing Survey figures are available here: https://www.gov.uk/government/collections/english-housing-survey-2022-to-2023-headline-report#:~:text=In%202022%2C%2015%25%20of%20dwellings,9%25%20between%202019%20and%202022.
The figures on the number of installations needed per year to meet our climate commitments are from the data provided by the Committee on Climate Change in their sixth carbon budget. Available here: https://www.theccc.org.uk/publication/sixth-carbon-budget/
Previous NEF analysis of the cost savings associated with upgrading homes is available here: https://neweconomics.org/2022/11/an-emergency-insulation-plan-to-cut-bills-this-winter
The installation figures do not include homes upgraded privately without the use of government schemes. We consider that even accounting for this will not bring us in line with required progress.
Topics Climate change