Child poverty rises six times faster in most deprived areas compared to the richest
NEF analysis of new DWP stats show that child poverty in the poorest areas has increased by 8 percentage points since 2014/15
21 March 2024


Levels of child poverty have risen six (5.6) times faster in the most deprived areas since 2014/15 compared to the richest, analysis from the New Economics Foundation has revealed today.
The analysis of new data from the Department for Work and Pensions shows that levels of child poverty have increased by more than 8 (8.4) percentage points in the most deprived 10% of areas compared with a rise of less than 2 (1.5) percentage points in the most well off (figure 1).
19 of the 20 local authorities in the UK that saw the highest increase in child poverty were in the North West, East Midlands, and West Midlands. In the West Midlands, an additional 10% of children now live in poverty compared to 2015 (19% versus 28%). In the North West and East Midlands, this was 9%.
Sam Tims, senior economist at the New Economics Foundation, said:
“No child should have to grow up worrying about where their next meal is coming from or whether their parents can afford to pay the bills – but that’s the reality for millions in this country. We should be making progress on reducing the number of children in poverty, instead this country is going backwards – with the poorest places taking the biggest hit.
“This is also clear evidence that the government’s levelling-up agenda is failing. What we are seeing is a deepening of poverty in the very places that the government was supposed to lift up. The government could take millions of children out of poverty and help those in the most deprived places by scrapping the two-child limit and increasing universal credit.”
The areas with the largest increase between 2014/15 and 2022/23 include (figure 2):
- Nottingham saw a 16 percentage point increase with 40% of children living in child poverty
- Birmingham saw a 14 percentage point increase with 41% of children living in child poverty
- Leicester saw a 13 percentage point increase with 41% of children living in child poverty
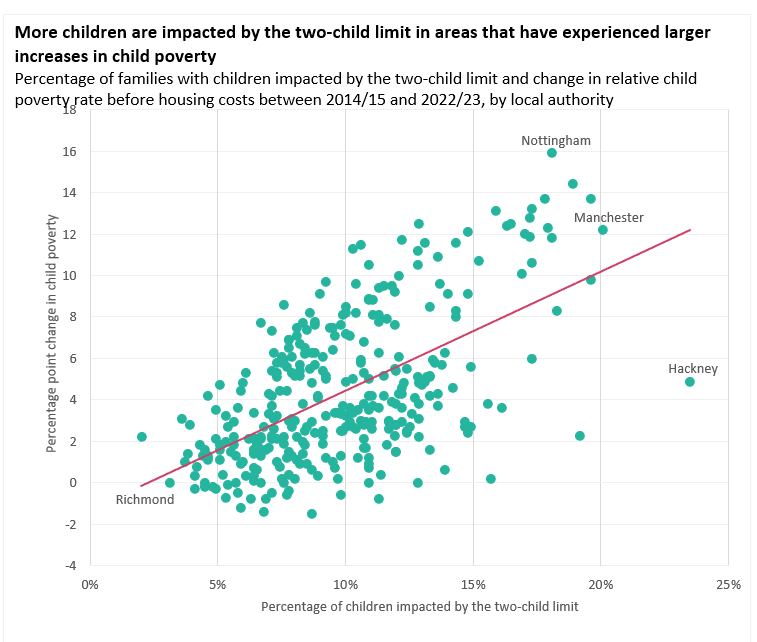
The analysis also revealed that local authorities that experienced the biggest increase in child poverty were the places where more families are impacted by the two-child limit. In Nottingham, where child poverty has increased by 16 percentage points, 18% of children were impacted by the two-child limit as of April 2022. In Pendle, where 14 percent more of all children live in poverty compared to 2014/15, 19% were impacted by the two-child limit.
Child poverty rates for families with one or two children have remained broadly stable in recent years, while the poverty rate for larger families has increased by 13 percentage points since the low of 2012/13, from 33% to 46%.
ENDS
Contact
Katrina Gaffney — katrina.gaffney@neweconomics.org — 07983596818
Notes
The New Economics Foundation is a charitable think tank. We are wholly independent of political parties and committed to being transparent about how we are funded.
Analysis is based on DWP, children in low income families: local areas statistics, using relative child poverty before housing costs. Local data is derived from DWP, households below average income, administrative earnings data and population estimates.
Figure 1
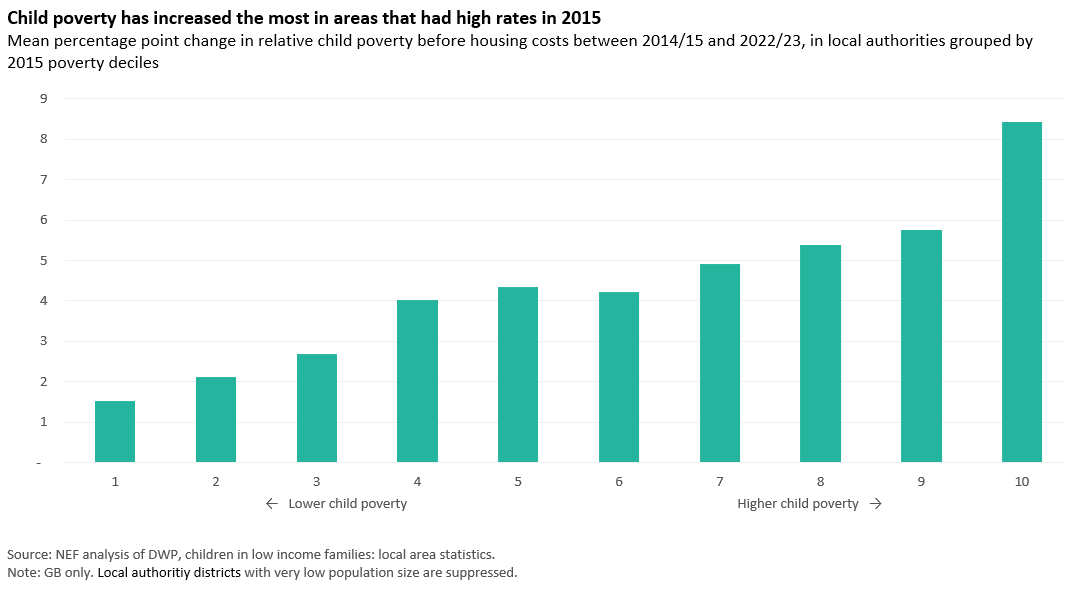
Figure 2
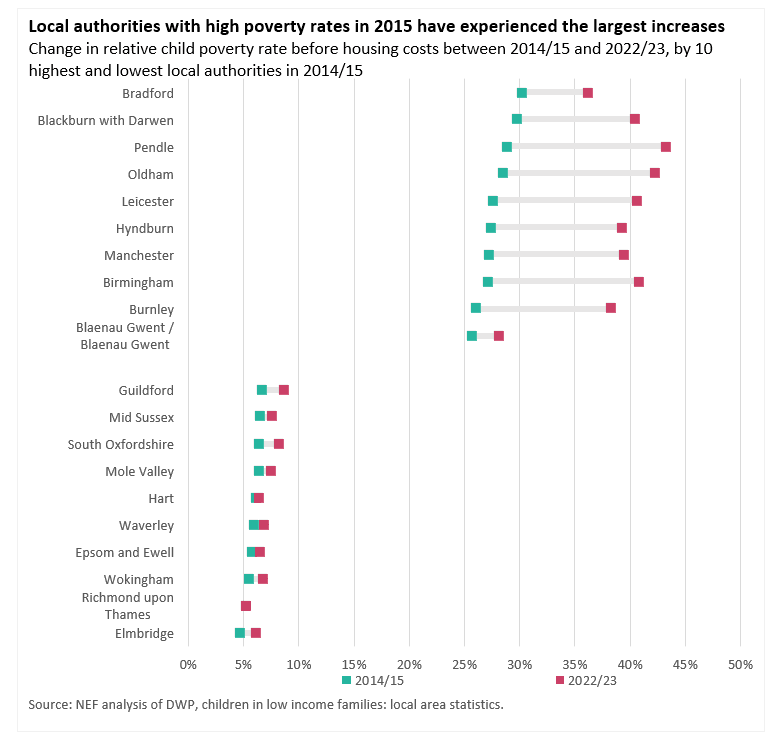
Figure 3
Topics Social security