What’s behind the rise in disability benefit claims?
Rising rates of disability colliding with greater financial hardship are pushing more people to seek support
06 May 2025


Part of the government’s justification for its cuts to disability and incapacity benefits is that the number of disabled working-age people in England and Wales has risen by 17% since the pandemic, but the number of people receiving incapacity[i] or disability benefits[ii] has increased by double this rate – 34%. The implication seems to be that these benefits are going to people that they weren’t intended to support.
While this sounds, on paper, like a concerning trend, in reality it may simply indicate that legitimate demand for these benefits is not solely determined by whether more people are disabled.
First, let us consider why the number of disabled working-age people may have risen by 17%. We know that the pandemic had huge knock-on consequences for health and health inequalities. This has been compounded by a cost-of-living crisis that has also had profound impacts on our health. Mental health has been particularly affected, with 36% more people in contact with mental health services in 2024 than in 2019. This is reflected in a steep rise in claims for disability benefits where mental health problems are cited as someone’s ‘primary condition’.
However, this government argues that the number of people receiving disability and incapacity benefits has grown twice as fast as the rate of growth in disabilities. It may seem intuitive that a rise in claims for these benefits would be driven primarily by a rise in the number of disabled people, but in reality many disabled people do not claim associated financial support. This could be because they are not aware of what’s available, they are put off by the often-strenuous process of proving eligibility, or they do not feel they need additional support.
The rise in disability and incapacity benefit claims is therefore dependent on trends in both disability and the proportion of disabled people who are eligible for and apply for support. By comparing the total number of disabled people – defined using the Equality Act – to the number claiming disability and/or incapacity benefits, we can see that the proportion of disabled people claiming these benefits stood at around 40% before the pandemic but has since grown to 46%.
While the government argues that the rise in rates of disability is out of step with the rise in those claiming disability and incapacity benefits, this could simply be down to greater legitimate take-up rate within the disabled population, rather than increased claims from people for whom the benefit was not intended.
The main change that the government is proposing in response is to tighten eligibility for the personal independence payment (PIP), leading to 800,000 fewer people receiving the benefit by 2029 – 30. PIP is the benefit for which there has been the biggest post-pandemic increase in claims – 28% of disabled people received the benefit in 2019, rising to 33% in 2023. Because it is non-means tested and not based on working status, it also allows us to explore a wider range of mediating factors that might explain why claims have increased.
The first thing to consider is whether the assessment success rate has changed for people applying for PIP. A falling success rate would suggest more people are applying who the benefit was not intended for or that the assessment is getting harder to pass. A rising success rate would suggest the assessment is getting easier to pass or that more people are applying with disabilities that have a greater impact on their lives.
However, we find a fairly static success rate, suggesting that the benefit is continuing to go to the people it was intended to support even though more people are applying. This that not all disabled people who may be eligible for PIP are claiming, which in turn suggests that other factors are mediating whether people apply beyond just the severity and impact of their disabilities.
Another way to understand these trends is to look at how levels of PIP claims vary across the country. By doing this, we can examine how much this distribution is accounted for by disability prevalence and – crucially – what else might help to explain any variation. We find that the geographical spread of the areas that have the highest number of disabled people (on the left of figure 3) is very similar to the areas of the country which have the most amount of people claiming PIP (on the right).
Figure 3: The areas of the country with the highest disability prevalence have the highest PIP claims
Number of disabled people and PIP caseload by local authority
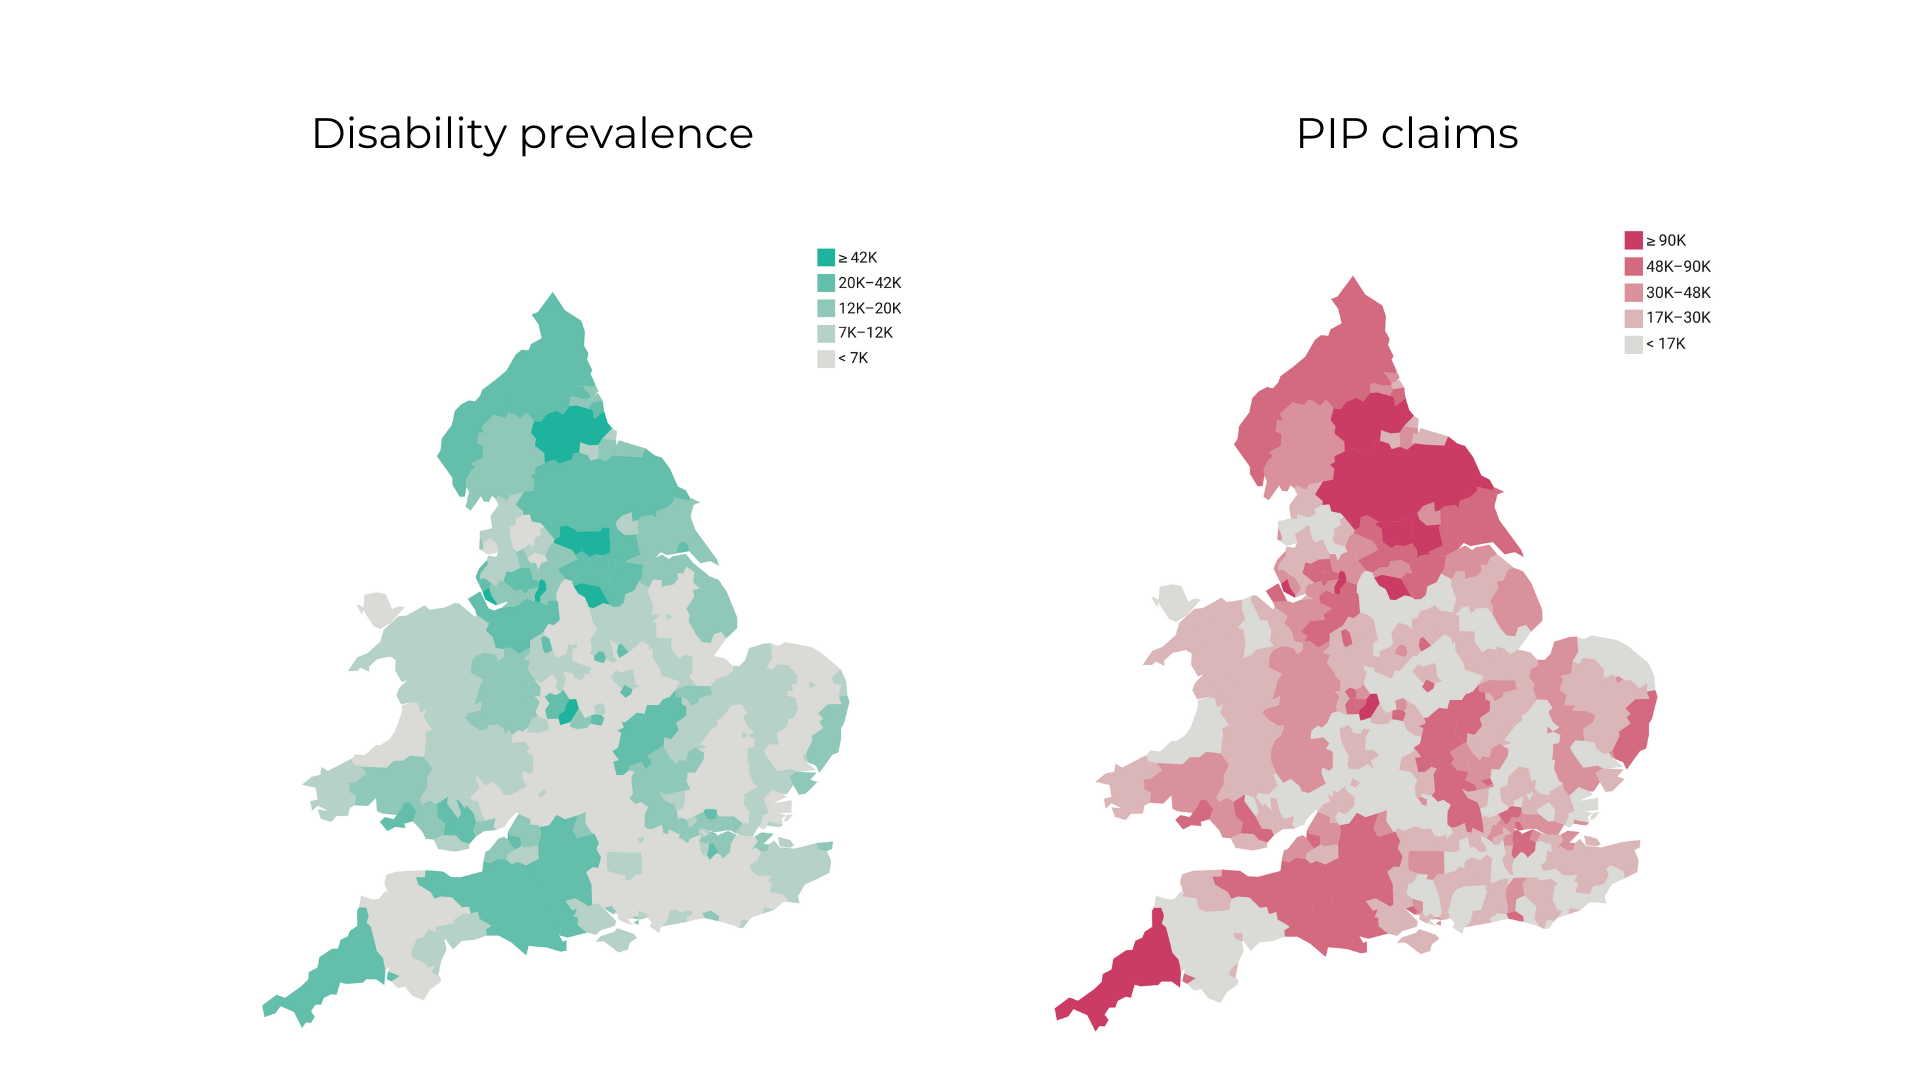
Notes: Figures taken from December 2024 for disability prevalence and January 2025 for PIP caseload
Source: NEF Analysis of the Labour Force Survey (LFS) Personal Independence Payment: Cases with Entitlement from 2019 (DWP)
We can see this further by placing all the regions on the x axis of figure 4 based on how many people claim PIP, and the number of disabled people in that region on the y axis. This shows that there is a strong correlation between these two variables, meaning that, as you would expect, areas with high numbers of disabled people also see high numbers of PIP claims.
While this correlation is strong, there is still some unexplained variation, such as Buckinghamshire which has a high proportion of disability prevalence but a lower number of people claiming PIP than we would expect. But as Buckinghamshire is a more affluent region, it’s possible that fewer disabled people in the region feel the need to claim disability benefits.
We can extend this analysis with a series of regressions to test if regional social and economic disadvantage plays a role in explaining regional PIP caseload at a particular point in time. On its own, the number of disabled people explains 71% of the PIP caseload in a particular region. But when we add each region’s relative deprivation using the Index of Multiple Deprivation (IMD) we can explain 94% of the regional PIP caseload.
We know that disabled people have struggled in particular during the cost-of-living crisis. 12% of disabled people report not to be able to pay their bills in the past 12 months, compared to 5% of non-disabled people. The proportion of disabled people who cannot reliably afford adequate healthy food rose from 11% in 2021 – 22 to 16% in 2023 – 24. For non-disabled people, these figures rose from 3% to 6%.
Rather than indicating that PIP is being awarded to people less in need or deserving of the support than in the past, our analysis suggests that the rise in claims is symptomatic of rising rates of disability combined with worsening hardship. A rise in disability makes more people eligible for PIP, while worsening hardship means that more people who were previously eligible for PIP, but did not apply for it, now feel the need to apply for additional financial support.
On this basis, it seems unlikely that the proposed tightening of eligibility for PIP as the government is planning will achieve much other than causing further hardship for a group struggling the most since the pandemic. It’s also likely that the cost savings from this are not as high as assumed, as it’s often the case that benefit cuts and/or tightened eligibility result in people transitioning from one benefits system to another one (eg, council tax relief) as they search for alternative financial support.
Instead, the government needs to develop a plan for addressing the underlying factors that are leading more people to become disabled or experience ill-health, as well as an economic strategy to reduce the number of people experience financial insecurity.
Image: iStock