Poorest fifth still £380 worse off a year after chancellor’s boost to universal credit, compared to £20 uplift
300,000 more people will be in poverty compared with if the £20 uplift hadn’t been cut
28 October 2021


Even after yesterday’s boost to universal credit announced in the autumn budget, the poorest fifth of people would have been £380 a year better off on average if the £20-a-week uplift had stayed in place instead, according to analysis out today from the New Economics Foundation (NEF). The analysis finds that reversing this month’s £20-a-week cut to universal credit, rather than lowering the taper rate and raising work allowances — which determine the amount of universal credit withdrawn for every £1 someone earns — would have prevented 300,000 more people from being pushed into poverty this winter.
In the first week of October, the £20-a-week uplift to universal credit payments introduced during the pandemic was removed. At yesterday’s budget, the chancellor announced that the universal credit taper rate will be reduced from 63% to 55%, and that work allowances will be increased by £42 a month. These measures are expected to take effect in the coming weeks. Today’s analysis from NEF modelling compared the effects of the government’s changes to universal credit by December this year, compared to the impact if the £20 uplift had stayed in place instead. They found that the chancellor’s changes to universal credit will push 300,000 more people into poverty than if cuts to the benefit had been reversed.
The New Economics Foundation is calling for the UK’s social security to be revamped in order to introduce a Living Income. This would set an‘income floor’ – a level below which no one can fall that is sufficient to meet everyday needs.
Lukasz Krebel, economist at the New Economics Foundation, said:
“The chancellor was right to cut the universal credit taper rate and increase work allowances yesterday, reducing the excessive marginal tax rates on additional earnings faced by those on the lowest incomes.
However, this won’t touch the sides when it comes to reversing the impacts of cutting universal credit by £20 a week. Neither will it lift the UK’s meagre social-security system to a similar level to other advanced economies. And while it offers some improvements for claimants who are in employment, it offers nothing at all for those unable to work or struggling to find work.
To create the prosperous, high-wage economy the chancellor claims to want, the government cannot push hundreds of thousands of people into poverty. A more generous social-security system would aid our economic recovery from the pandemic, because recipients of universal credit would spend more, helping to create more jobs and higher tax receipts for the government.”
Notes to editors
The New Economics Foundation is a charitable think tank. We are wholly independent of political parties and committed to being transparent about how we are funded.
Information on NEF’s Living Income campaign can be found here.
NEF analysis is based on the IPPR Tax-benefit model using data from the Office for Budget Responsibility, Office for National Statistics and Department for Work and Pensions’ Family Resources Survey. All modelling is simulated for the December 2021 labour market, using projections for earnings, unemployment and other aggregates from the OBR’s core forecast scenario. The poverty threshold is defined as 60% of median income, after housing costs, with median incomes recalculated to take into account a given policy change. Poverty figures include adults and children and are rounded to the nearest 100,000.
Table 1. Comparison of extended £20 uplift, and government budget decisions, compared to pre-budget policy.
Cost and impact on household, adult, child and total people poverty (relative poverty at 60% of median income after housing costs) of government Bbudget changes to the Uuniversal Ccredit and modelled extension of the £20 uplift, compared to government policy pre-Bbudget (as of 26 October 2021) for a range of working and non-working households with and without children, December 2021
£20 uplift kept | Government budget reforms | Difference | |
Cost relative to baseline | 5,600 | 2,200 | 3,400 |
Change in relative poverty after housing costs | |||
Adults | -300,000 | -100,000 | -200,000 |
Children | -200,000 | -100,000 | -100,000 |
Households | -200,000 | -100,000 | -100,000 |
Total people | -500,000 | -200,000 | -300,000 |
Figure 1. Mean annual changes in household disposable income, after housing costs
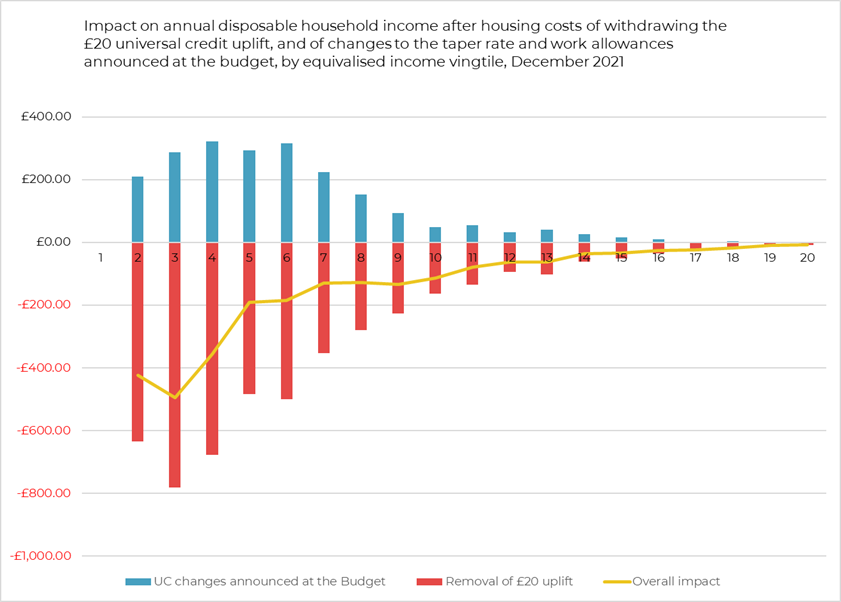
Impact (rounded to nearest £10) on annual disposable household income after housing costs of withdrawing the £20 universal credit uplift, and of changes to the taper rate and work allowances announced at the budget, by equivalised income vingtile, December 2021
Vingtile | UC changes announced at the Budget | Removal of £20 uplift | Overall impact |
Lowest income 5% | - | - | - |
2 | 210 | -630 | -420 |
3 | 290 | -780 | -490 |
4 | 320 | -680 | -360 |
5 | 290 | -480 | -190 |
6 | 310 | -500 | -180 |
7 | 220 | -350 | -130 |
8 | 150 | -280 | -130 |
9 | 90 | -230 | -130 |
10 | 50 | -160 | -110 |
11 | 60 | -140 | -80 |
12 | 30 | -90 | -60 |
13 | 40 | -100 | -60 |
14 | 30 | -60 | -40 |
15 | 20 | -50 | -30 |
16 | 10 | -30 | -30 |
17 | 0 | -30 | -20 |
18 | 0 | -20 | -20 |
19 | 0 | -10 | -10 |
Highest income 5% | 0 | -10 | -10 |
Campaigns Living income
Topics Social security