Nearly half of all children will be living in families that have to make sacrifices on essentials this autumn, like putting food on the table or replacing clothes and shoes
New analysis by the New Economics Foundation shows that by November 2021 a third of households – 21.4 million people - will be unable to make ends meet
17 June 2021
Nearly one in three (32%) of households, equivalent to 21.4 million people, will be living on an income where they are unable to afford day-to-day necessities when emergency pandemic support is scheduled to be removed after September 2021, according to new analysis by the New Economics Foundation (NEF) published today. This figure includes nearly half (45%) of all children eight in 10 (82%) of children in families out of work, and four in 10 (40%) in working families.
The report uses the Minimum Income Standard (MIS), which is the UK’s only needs-based approach to measuring living standards and is used to calculate the ‘real’ Living Wage paid by companies like Ikea and KPMG, and football clubs like Chelsea, Liverpool and Everton
The analysis shows that the 21.4 million people in the UK projected to be living below the MIS threshold by November will include:
- 70% of single parents
- Half of all renters (50%)
- More than a third of all families in the North East (37%), West Midlands (37%) and London (35%)
- A quarter (26%) of adults in working families
The analysis also shows that even if the £20 per week ‘uplift’ in Universal Credit is extended beyond September, 20.8 million people (31%) including 6.5 million children (43%) will be living below the MIS by November.
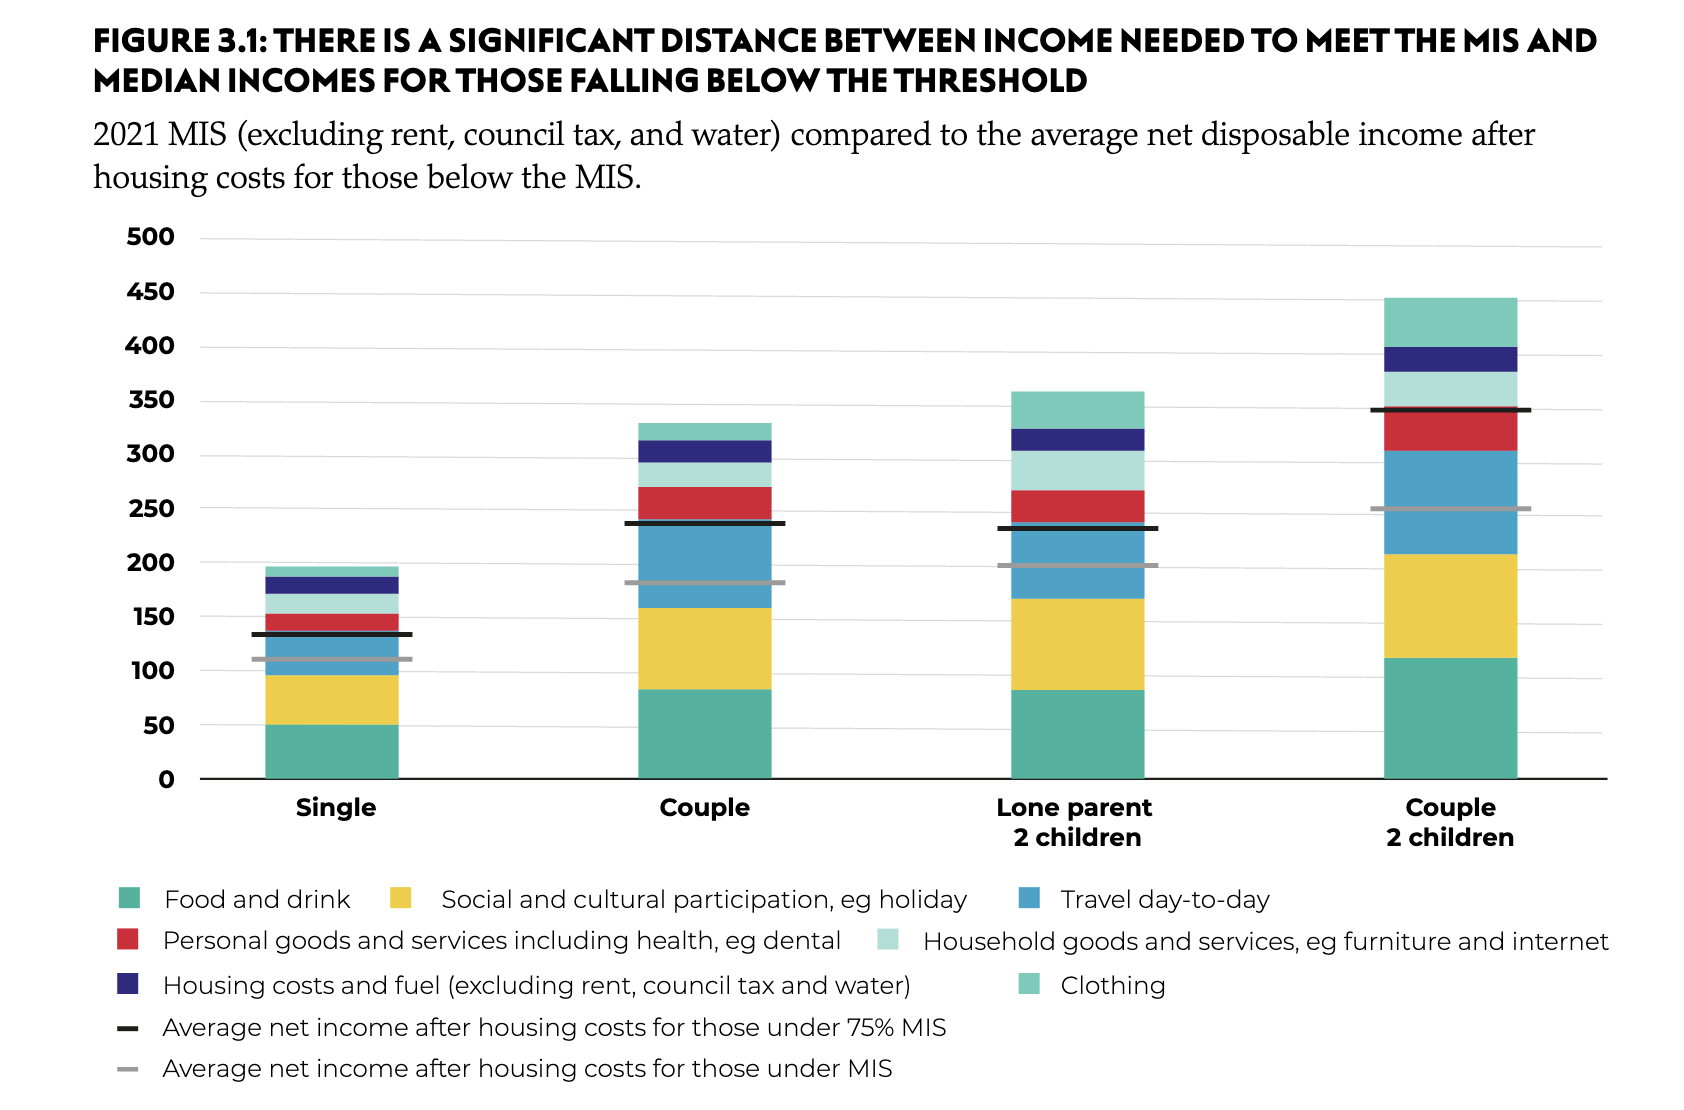
The report not only shows the number of people falling below an adequate level of income but also the extent to which their incomes are falling short too. The average single person with an income under the MIS this autumn will be falling short by £3,540 per year after housing costs, and for a single parent with two children, the same figure is £6,810 per year. In both cases, these types of families would need to see their incomes increase by at least 50% before they reached the MIS.
Among those relying on the welfare system to get by, the picture is even worse. The report highlights that the number of people claiming Universal Credit more than doubled from 2.8 million in January 2020, to an estimated 5.9 million in January 2021. After housing costs, a single parent with two children needs to buy food, pay bills, and afford occasional extras like birthday presents or new school shoes on just £194 a week (£214 if the uplift is maintained).
By November, the average lone parent on Universal Credit with two children will be falling short of what they need to cover the costs of essentials (after housing costs) by £6,850 per year and a couple with two children will be short by £6,220 per year. A single person without children will be short by £4,700 and would need their income to almost double in order to reach the MIS. The modelling by NEF, which includes a breakdown of family expenses on essentials, shows that these households would likely have to choose between putting enough food on the table and paying for one off costs like new clothes or shows, or going to the dentist.
The report therefore calls for the creation of a new social security system, or ‘Living Income’, which would ensure that everyone has enough income for a decent quality of life, whether in or out of work. The new system would sit alongside policies to support higher paying and more secure work and to expand public service provision. It should be based on four key principles of alleviating poverty, reducing inequality, supporting economic stability and increasing economic resilience.
Sarah Arnold, Senior Economist at the New Economics Foundation, said
“The UK is in the midst of a crisis in living standards. Too many people don’t have reliable access to the resources they need to meet day-to-day costs and so have to choose between which essential items they can afford such as food, replacement clothes and new school shoes.
“In the UK, wages are too low and the social security system fails comprehensively to provide an adequate income floor. Welfare is weak by both international and historical standards. Therefore NEF are calling for the creation of a new social security system, or ‘Living Income’, alongside policies to support higher paying and more secure work and to expand public service provision, which should be built around principles of alleviating poverty, reducing inequality, supporting economic stability and increasing economic resilience.”
Contact
Sofie Jenkinson, sofie.jenkinson@neweconomics.org, 07981023031
Notes to editors
The report ‘The UK’s living standards crisis: The case for a living income’ will be available at 00.01 Thursday 17th June at: https://neweconomics.org/2021/06/the-uks-living-standards-crisis
The New Economics Foundation is a charitable think tank. We are wholly independent of political parties and committed to being transparent about how we are funded.
The minimum income standard differs from other approaches to measuring living standards because it is based on assessment of the goods and services households need to live and thrive in contemporary Britain. Other measures, such as the relative or absolute poverty measures used by the government are based on average incomes rather than need. The minimum income standard (MIS) sets the bar not at survival, but at a “minimum socially acceptable standard of living”, best on JRF’s levels of poverty:
- Destitute – a person who is destitute cannot afford to eat, keep clean and stay warm and dry.
- Struggling – falling substantially short of a decent standard of living a struggling person is likely to be experiencing some form of material deprivation, where they cannot afford certain essential items and activities.
- Surviving – getting by day-to-day but under pressure, finding it difficult to manage unexpected costs and events.
- Thriving – able to afford a decent standard of living.
The Joseph Rowntree Foundation (JRF) have consulted with the UK population and, with the Centre for Research in Social Policy (CRSP), run the numbers to produce a meticulous methodology for estimating the MIS on a family-by-family basis. The results are shown with and without housing and childcare costs, because in practice it these costs (housing and childcare) vary significantly across households and regions of the UK.
Following the JRF and CRSP approach, NEF has conducted new analysis to provide a forecast estimate for the number of people falling below the MIS in the autumn of 2021. We use calculations of the appropriate Minimum Income Standard according to family type, kindly provided by the Centre for Research in Social Policy at the University of Loughborough (although we simplify slightly and group families into 12 types — single, single with one to four children inclusive, couple, couples with one to four children inclusive, single pensioner and couple pensioner). The most up to date MIS calculations available are for 2020, and so we uprate these to give 2021 benchmarks using expected inflation (CPI) for April 2021 from the most recent estimates from the Office of Budgetary Responsibility.
We forecast household incomes in November 2021 under current government policy, assuming the furlough scheme ends in September 2021, and there are no further SEISS payments from the end of September. We assume the minimum income floor in universal credit is no longer suspended, but we show results with and without the £20 uplift being extended beyond September 2021. Household incomes are estimated using the IPPR tax benefit model and data from the Department for Work and Pensions Family Resources Survey.
Table 3.2: A significant number of people living in families with incomes below the MIS
Proportion of people in various different household types, regions, and tenures living in households with net disposable income below the MIS, November 2021
% under MIS |
% under 75% MIS |
% in relative poverty (measured by 60% of median 2010/11 income AHC) |
|
All |
32% |
19% |
23% |
All children |
45% |
26% |
26% |
(children in workless families) |
82% |
64% |
64% |
(children in working families) |
40% |
21% |
21% |
All adults of working age |
32% |
20% |
32% |
(adults in workless families) |
75% |
53% |
68% |
(adults in working families) |
26% |
15% |
26% |
By family type |
|||
Couple of working age with children |
35% |
19% |
25% |
Couple of working age without children |
19% |
11% |
13% |
Single person of working age with children |
70% |
47% |
48% |
Single person of working age without children |
39% |
28% |
26% |
Single person of pension age |
27% |
10% |
24% |
Couple of pension age |
14% |
6% |
15% |
By region |
|||
Scotland |
27% |
15% |
19% |
South East |
27% |
15% |
20% |
East Midlands |
29% |
16% |
20% |
East of England |
29% |
17% |
21% |
South West |
30% |
16% |
21% |
Wales |
33% |
17% |
21% |
Northern Ireland |
33% |
16% |
24% |
North West and Merseyside |
34% |
19% |
25% |
Yorkshire and Humberside |
34% |
20% |
24% |
West Midlands |
35% |
21% |
25% |
North East |
37% |
22% |
26% |
London |
37% |
26% |
29% |
By tenure |
|||
Owner occupier |
18% |
8% |
12% |
Private renter |
50% |
34% |
36% |
Social housing/Housing Association |
63% |
40% |
49% |
Source: NEF analysis of JRF/CRSP MIS and FRS using the IPPR tax benefit model


